|
|
# 28 | 定向监控:怎样快速发现业务异常?
|
|
|
|
|
|
你好,我是高楼。这节课,我们来讲一讲定向监控。
|
|
|
|
|
|
其实全局监控和定向监控,我在三个专栏里都反复提过。你可能会问了,既然之前都写过了,为什么还要在这个专栏中专门再写一篇呢?毕竟凑字也不是我的风格,我还真是要写点不一样的东西。
|
|
|
|
|
|
在这一节课,我会主要介绍业务级的定向监控,也就是要实现业务代码级的监控。如果你想学习更多定向监控的知识,也可以看看我以前讲过的内容: [《性能测试场景:如何进行监控设计?》](https://time.geekbang.org/column/article/190132) 和 [《如何设计全局和定向监控策略?》](https://time.geekbang.org/column/article/361138) 。
|
|
|
|
|
|
话说回来,为什么要做业务级的定向监控呢?因为线上压测是有风险的,这个大家都知道。而做到业务级的定向监控可以降低压测风险。
|
|
|
|
|
|
业务级的定向监控对于刚入行的性能测试小白来说确实是一个新话题,但对于从事多年性能测试老鸟来说并不奇怪。那我们怎么具体落地呢,下面我们就来仔细看一看。
|
|
|
|
|
|
## 本地环境准备
|
|
|
|
|
|
在之前的课程里,我已经介绍了市场上常见的监控工具,这里我就结合 Prometheus SDK 来说说如何改造代码并落地业务 Metrics 埋点 。
|
|
|
|
|
|
> Prometheus 提供度量的四种基本类型包括:Counter,Gauge,Histogram,Summary。
|
|
|
|
|
|
这里,我主要演示电商项目下单业务的定向监控。我们会主要采集**订单成功次数、订单失败次数、订单金额总数**等业务的 Metrics,如果你还想扩展其它业务,也可以参考这一方法进行改造。
|
|
|
|
|
|
依照惯例,我还是先在本地搭建 demo 做技术预演,预演成功后再做真实系统改造。
|
|
|
|
|
|
首先,我们要搭建 Prometheus 集成 Grafana 的本地环境。具体的操作你可以参考下面三篇文章:
|
|
|
|
|
|
* [《性能监控之初识 Prometheus》](https://mp.weixin.qq.com/s/C6E0Ak-dokBtuTzTczZAaA)
|
|
|
* [《性能监控之 node\_exporter+Prometheus+Grafana 实现主机监控》](https://mp.weixin.qq.com/s/IakvrGQBzTSq_FPUF-pAYw)
|
|
|
* [《性能监控工具之Grafana+Prometheus+Exporters》](https://time.geekbang.org/column/article/190684)
|
|
|
|
|
|
环境搭建好之后,运行效果如下:
|
|
|
|
|
|
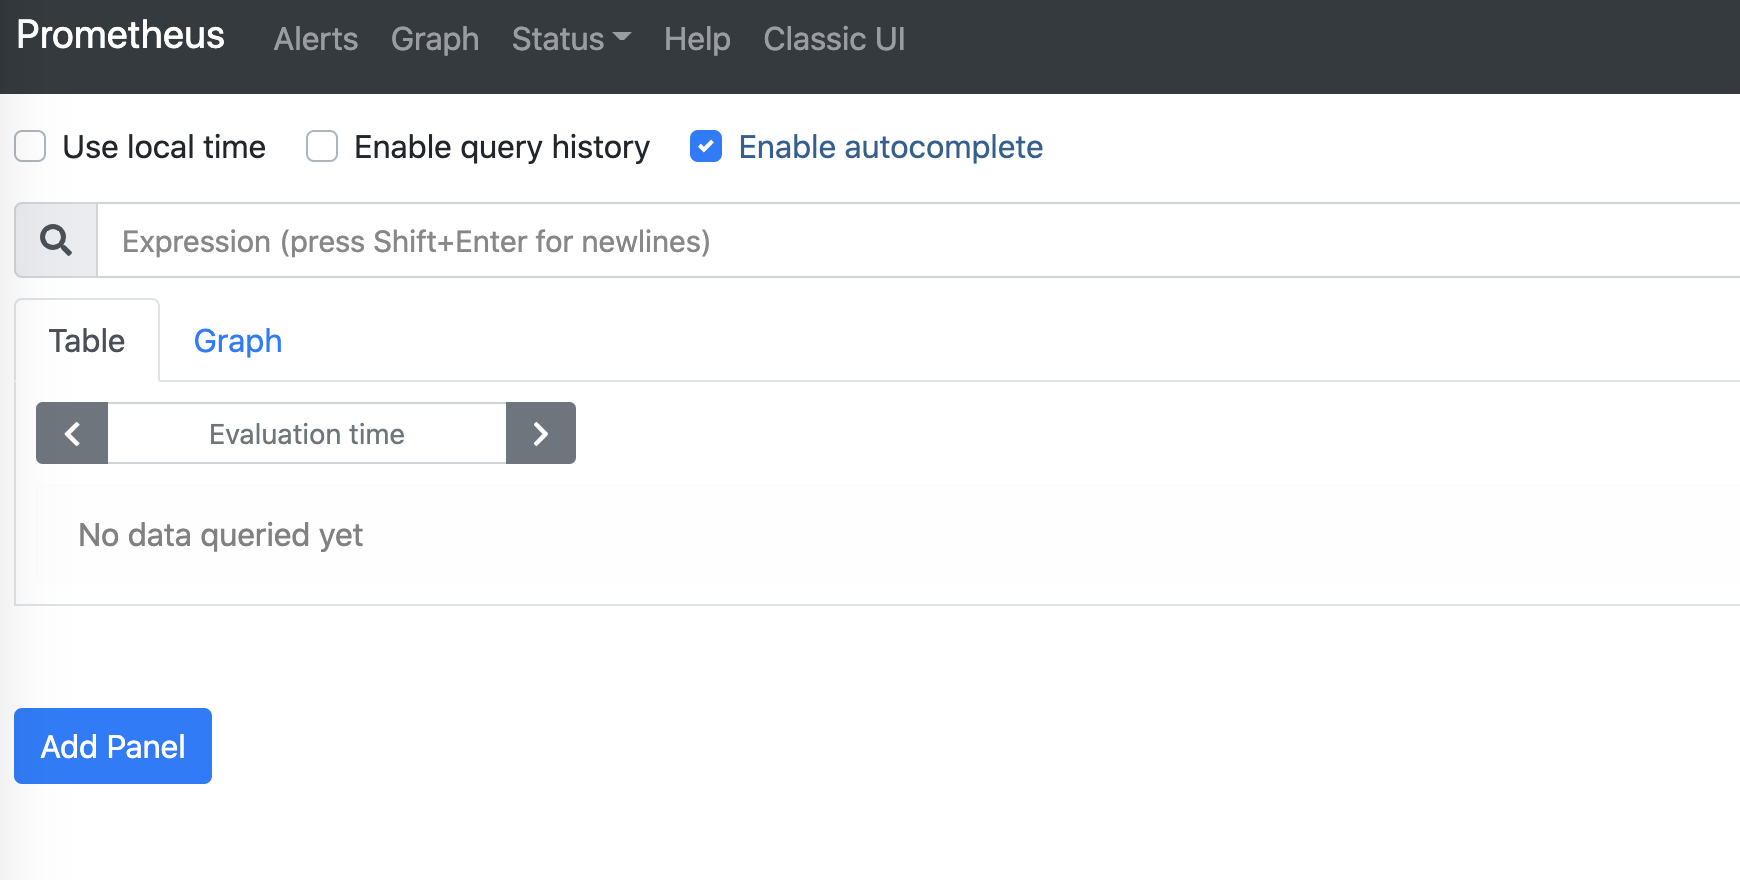
Prometheus 监控系统:
|
|
|
|
|
|
|
|
|
|
|
|
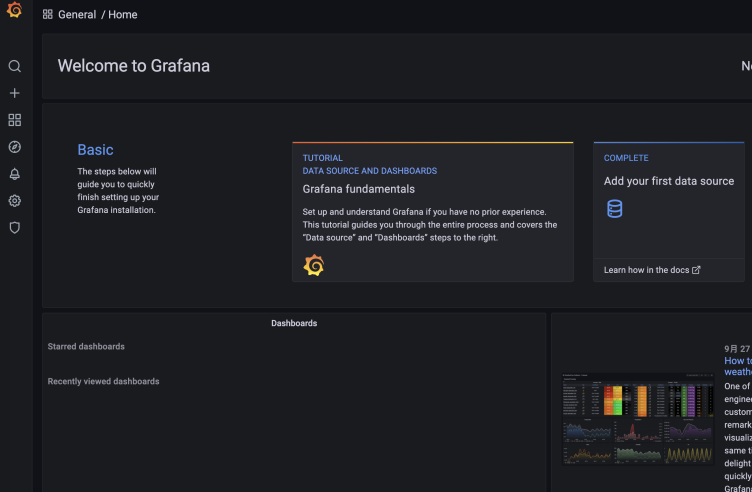
Grafana 可视化看板:
|
|
|
|
|
|
|
|
|
|
|
|
这样,我们用 Prometheus 集成的 Grafana 的本地环境就准备好了。
|
|
|
|
|
|
## demo 技术预演
|
|
|
|
|
|
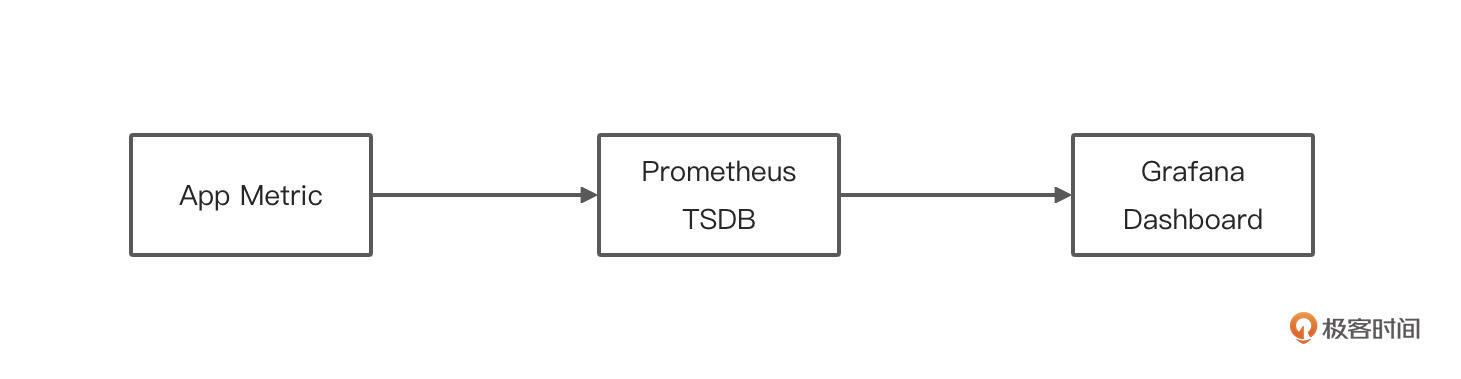
下一步,我们就要搭建业务级的定向监控 demo了,你可以先看下这张逻辑图:
|
|
|
|
|
|
|
|
|
|
|
|
一般情况下,使用 Prometheus SDK 做业务埋点主要有这几个步骤:
|
|
|
|
|
|
1. 创建 Prometheus Metric 数据项,可以创建一个自定义类;
|
|
|
2. 注册定义好的 Metric;
|
|
|
3. 在业务代码中埋点,对 TSDB 数据写入操作;
|
|
|
4. 提供 HTTP API 接口,让 Prometheus 定时来收集 Metric 数据。
|
|
|
|
|
|
这是一个通用的埋点套路,无论是 Golang 还是 Java 应用都是适应的。下面我们来看下它在demo项目中的具体实现:
|
|
|
|
|
|
* 新建 SpringBoot 工程
|
|
|
|
|
|
使用 SpringBoot(项目使用的框架) 集成 Prometheus SDK。这里我们要导入相关依赖:
|
|
|
|
|
|
```xml
|
|
|
<dependency>
|
|
|
<groupId>io.micrometer</groupId>
|
|
|
<artifactId>micrometer-registry-prometheus</artifactId>
|
|
|
<version>1.7.4</version>
|
|
|
</dependency>
|
|
|
|
|
|
```
|
|
|
|
|
|
* 修改 SpringBoot 全局配置文件
|
|
|
|
|
|
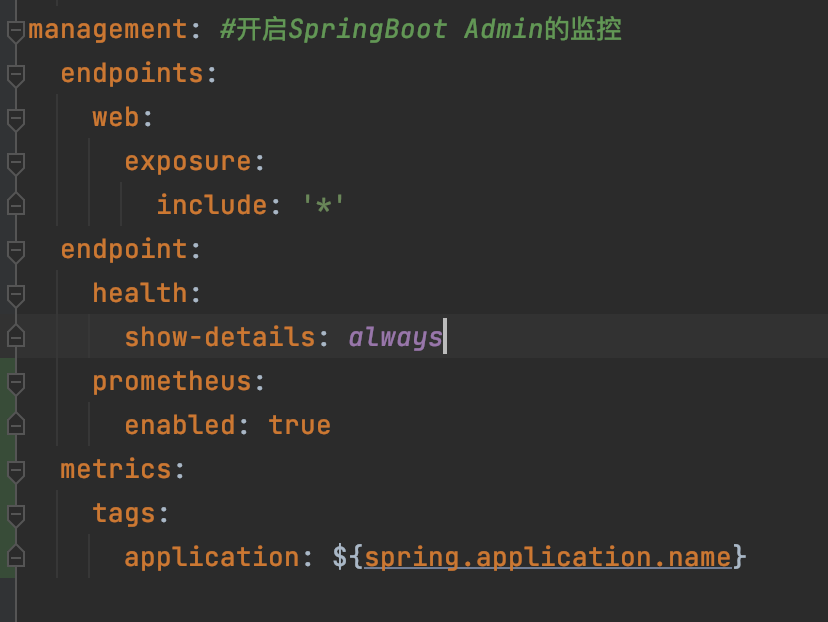
在 application.yml 文件中输入如下配置:
|
|
|
|
|
|
```yaml
|
|
|
spring:
|
|
|
application:
|
|
|
name: dunshan-prometh
|
|
|
|
|
|
server:
|
|
|
port: 8086
|
|
|
|
|
|
management:
|
|
|
endpoints:
|
|
|
web:
|
|
|
exposure:
|
|
|
include: '*'
|
|
|
endpoint:
|
|
|
health:
|
|
|
show-details: always
|
|
|
prometheus:
|
|
|
enabled: true
|
|
|
metrics:
|
|
|
tags:
|
|
|
application: ${spring.application.name}
|
|
|
|
|
|
```
|
|
|
|
|
|
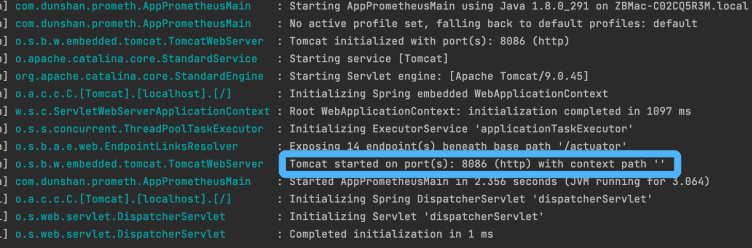
改好配置文件之后,启动应用服务器,可以看到 Metric 的访问路径和端口号:
|
|
|
|
|
|
|
|
|
|
|
|
我们通过路径和端口号可以得到下面这个地址: [http://localhost:8086/actuator/prometheus](http://localhost:8086/actuator/prometheus) 。
|
|
|
|
|
|
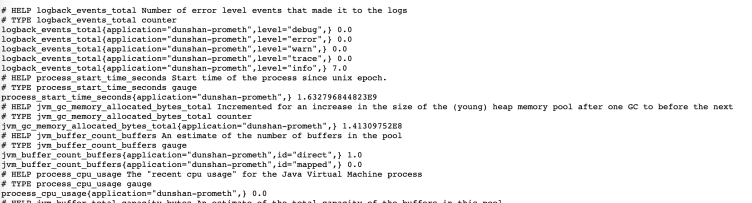
启动工程,在浏览器中输入这个地址,结果显示如下:
|
|
|
|
|
|
|
|
|
|
|
|
可以看到, Actuator Metrics 数据已经正常显示出来了。
|
|
|
|
|
|
* 配置 Prometheus 拉取数据
|
|
|
|
|
|
接下来,在 Prometheus 主程序的配置文件中填写上面的 Metrics 接口信息。
|
|
|
|
|
|
在 prometheus.yml 写入的配置你可以参考下面的代码:
|
|
|
|
|
|
```yaml
|
|
|
global:
|
|
|
scrape_interval: 15s
|
|
|
|
|
|
scrape_configs:
|
|
|
- job_name: "prometheus"
|
|
|
static_configs:
|
|
|
- targets: ["localhost:9090"]
|
|
|
|
|
|
- job_name: "dunshan-prometh"
|
|
|
metrics_path: "/actuator/prometheus"
|
|
|
static_configs:
|
|
|
- targets: ["localhost:8086"]
|
|
|
|
|
|
```
|
|
|
|
|
|
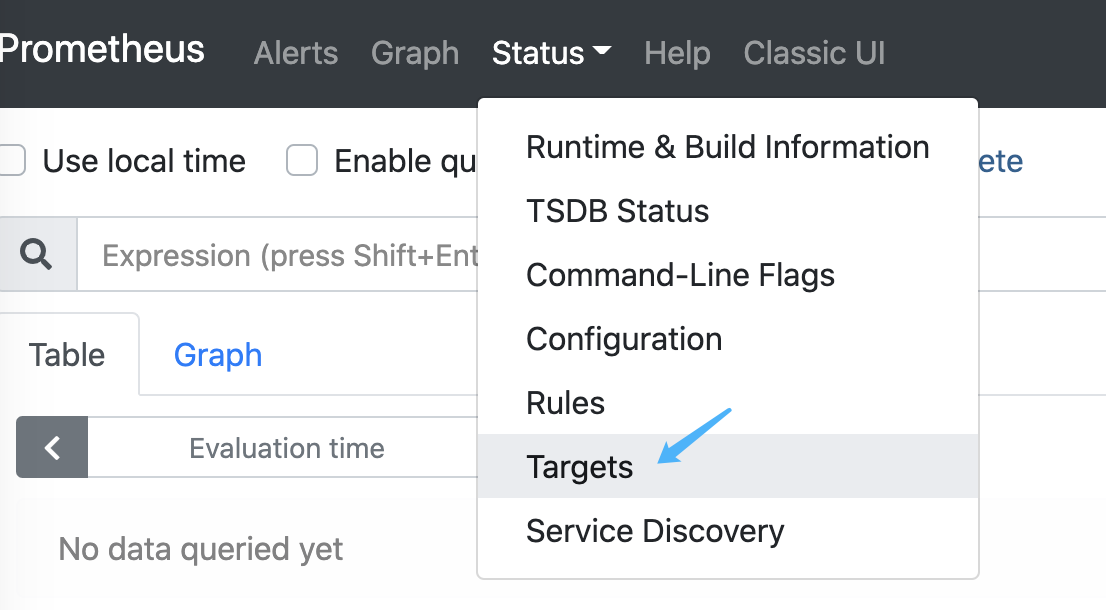
配置完之后,我们重启 Prometheus 服务,在浏览器中输入地址: [http://ip:9090](http://ip:9090) ,在控制台的 Status 菜单栏中选择 Targets:
|
|
|
|
|
|
|
|
|
|
|
|
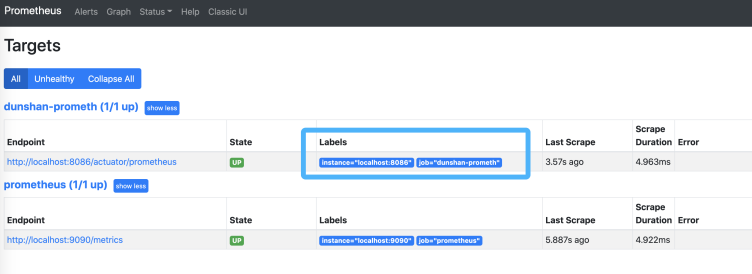
这样就能看到目前 Prometheus 收集的 Metrics 的路径了:
|
|
|
|
|
|
|
|
|
|
|
|
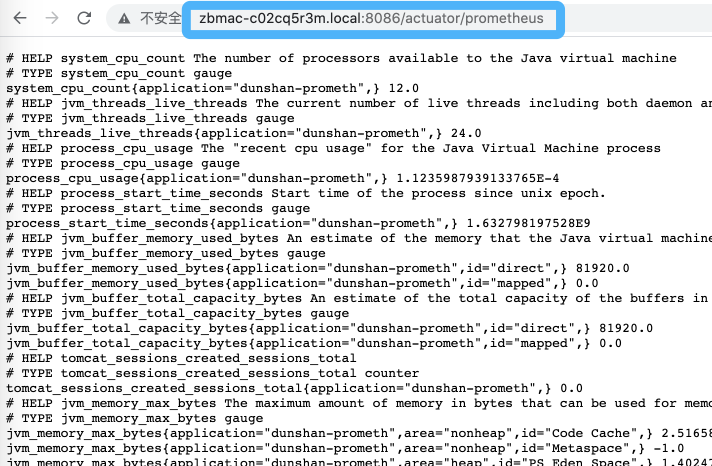
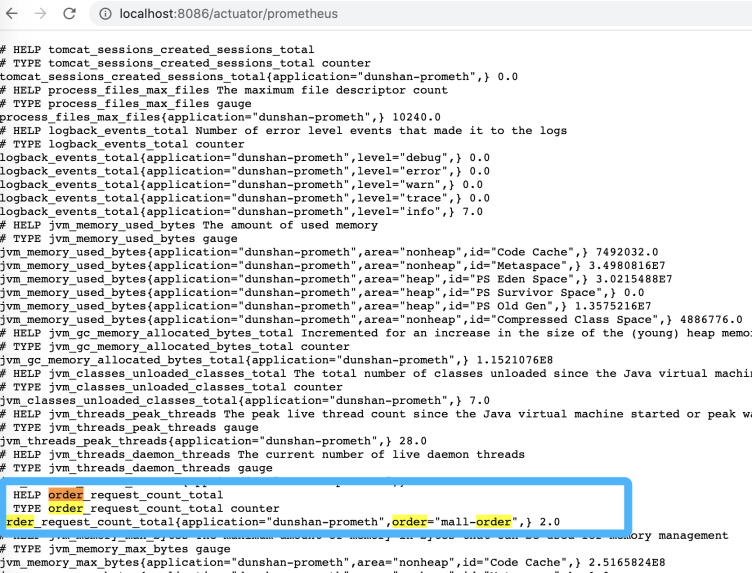
再次点击 [http://localhost:8086/actuator/prometheus](http://localhost:8086/actuator/prometheus) ,显示的信息如下:
|
|
|
|
|
|
|
|
|
|
|
|
这部分信息告诉我们,应用服务 Metrics 已经被 Prometheus 成功定时收集起来了。
|
|
|
|
|
|
接下来就要在应用服务中埋点收集数据了。在我们的业务服务里面,需要统计的 Metrics 有订单成功次数、订单失败次数和订单金额总数。我们可以通过对订单类中生成的订单号进行埋点来实现。
|
|
|
|
|
|
在项目中新增 PrometheusCustomMonitor 类,初始化业务 Metric。具体的代码参考如下:
|
|
|
|
|
|
```java
|
|
|
package com.dunshan.prometh.controller;
|
|
|
|
|
|
import io.micrometer.core.instrument.Counter;
|
|
|
import io.micrometer.core.instrument.DistributionSummary;
|
|
|
import io.micrometer.core.instrument.MeterRegistry;
|
|
|
import org.springframework.beans.factory.annotation.Autowired;
|
|
|
import org.springframework.stereotype.Component;
|
|
|
|
|
|
import javax.annotation.PostConstruct;
|
|
|
|
|
|
/**
|
|
|
* @author dunshan
|
|
|
* @program: dunshan-pef
|
|
|
* @description: 自定义下单接口采集类
|
|
|
* @date 2021-09-25 10:13:46
|
|
|
*/
|
|
|
@Component
|
|
|
public class PrometheusCustomMonitor {
|
|
|
|
|
|
/**
|
|
|
* 下单次数
|
|
|
*/
|
|
|
private Counter orderCount;
|
|
|
/**
|
|
|
* 下单失败数
|
|
|
*/
|
|
|
private Counter failureCount;
|
|
|
/**
|
|
|
* 金额统计
|
|
|
*/
|
|
|
private DistributionSummary amountSum;
|
|
|
|
|
|
|
|
|
|
|
|
private final MeterRegistry registry;
|
|
|
|
|
|
@Autowired
|
|
|
public PrometheusCustomMonitor(MeterRegistry registry) {
|
|
|
this.registry = registry;
|
|
|
}
|
|
|
|
|
|
@PostConstruct
|
|
|
private void init() {
|
|
|
//统计下单数
|
|
|
orderCount = registry.counter("order_request_count", "order", "mall-order");
|
|
|
//统计失败数
|
|
|
failureCount = registry.counter("order_failure_count", "order", "mall-order");
|
|
|
//统计金额数据
|
|
|
amountSum = registry.summary("order_amount_sum", "orderAmount", "mall-order");
|
|
|
|
|
|
}
|
|
|
public Counter getOrderCount() {
|
|
|
return orderCount;
|
|
|
}
|
|
|
|
|
|
public Counter getFailureCount() {
|
|
|
return failureCount;
|
|
|
}
|
|
|
|
|
|
public DistributionSummary getAmountSum() {
|
|
|
return amountSum;
|
|
|
}
|
|
|
|
|
|
}
|
|
|
|
|
|
```
|
|
|
|
|
|
声明了 Prometheus Metric 类之后,只要在业务方直接调用就可以了。这里我们直接在 Controller 层中增加请求进行模拟测试,从而实现对业务的埋点,收集我们想要的 Metrics 数据。
|
|
|
|
|
|
* 模拟业务请求
|
|
|
|
|
|
这里我们模拟调用请求,增加订单成功次数、订单失败次数和订单金额总数。
|
|
|
|
|
|
具体代码参考如下:
|
|
|
|
|
|
```java
|
|
|
package com.dunshan.prometh.controller;
|
|
|
|
|
|
import com.dunshan.prometh.popj.Result;
|
|
|
import lombok.extern.log4j.Log4j2;
|
|
|
import org.springframework.stereotype.Controller;
|
|
|
import org.springframework.web.bind.annotation.GetMapping;
|
|
|
import org.springframework.web.bind.annotation.PathVariable;
|
|
|
import org.springframework.web.bind.annotation.RequestMapping;
|
|
|
import org.springframework.web.bind.annotation.RestController;
|
|
|
|
|
|
import javax.annotation.Resource;
|
|
|
import java.util.HashMap;
|
|
|
import java.util.Random;
|
|
|
|
|
|
/**
|
|
|
* @author dunshan
|
|
|
* @program: dunshan-pef
|
|
|
* @description: 自定义监控采集控制层
|
|
|
* @date 2021-09-25 21:33:59
|
|
|
*/
|
|
|
@Log4j2
|
|
|
@Controller
|
|
|
@RestController
|
|
|
public class IndexPromenthController {
|
|
|
|
|
|
|
|
|
|
|
|
@Resource
|
|
|
private PrometheusCustomMonitor customMonitor;
|
|
|
|
|
|
|
|
|
|
|
|
@GetMapping("/")
|
|
|
public Result IndexPage() {
|
|
|
HashMap<Object,Object> map = new HashMap<>();
|
|
|
map.put("data", "全链路压测业务监控");
|
|
|
return Result.buildSuccess(map);
|
|
|
}
|
|
|
|
|
|
|
|
|
|
|
|
/**
|
|
|
* 模拟订单数据
|
|
|
*
|
|
|
* @param num
|
|
|
* @return
|
|
|
*/
|
|
|
@RequestMapping("/order/{num}")
|
|
|
public Result orderTotalNumber(@PathVariable int num) {
|
|
|
// 统计下单次数
|
|
|
if (num == 1) {
|
|
|
customMonitor.getOrderCount().increment();
|
|
|
} else {
|
|
|
//失败数据
|
|
|
customMonitor.getFailureCount().increment();
|
|
|
}
|
|
|
Random random = new Random();
|
|
|
int amount = random.nextInt(108);
|
|
|
// 统计金额
|
|
|
customMonitor.getAmountSum().record(amount);
|
|
|
HashMap<String,Object> map = new HashMap<>();
|
|
|
map.put("total",amount);
|
|
|
map.put("time",System.currentTimeMillis());
|
|
|
return Result.buildSuccess(map);
|
|
|
}
|
|
|
|
|
|
}
|
|
|
|
|
|
```
|
|
|
|
|
|
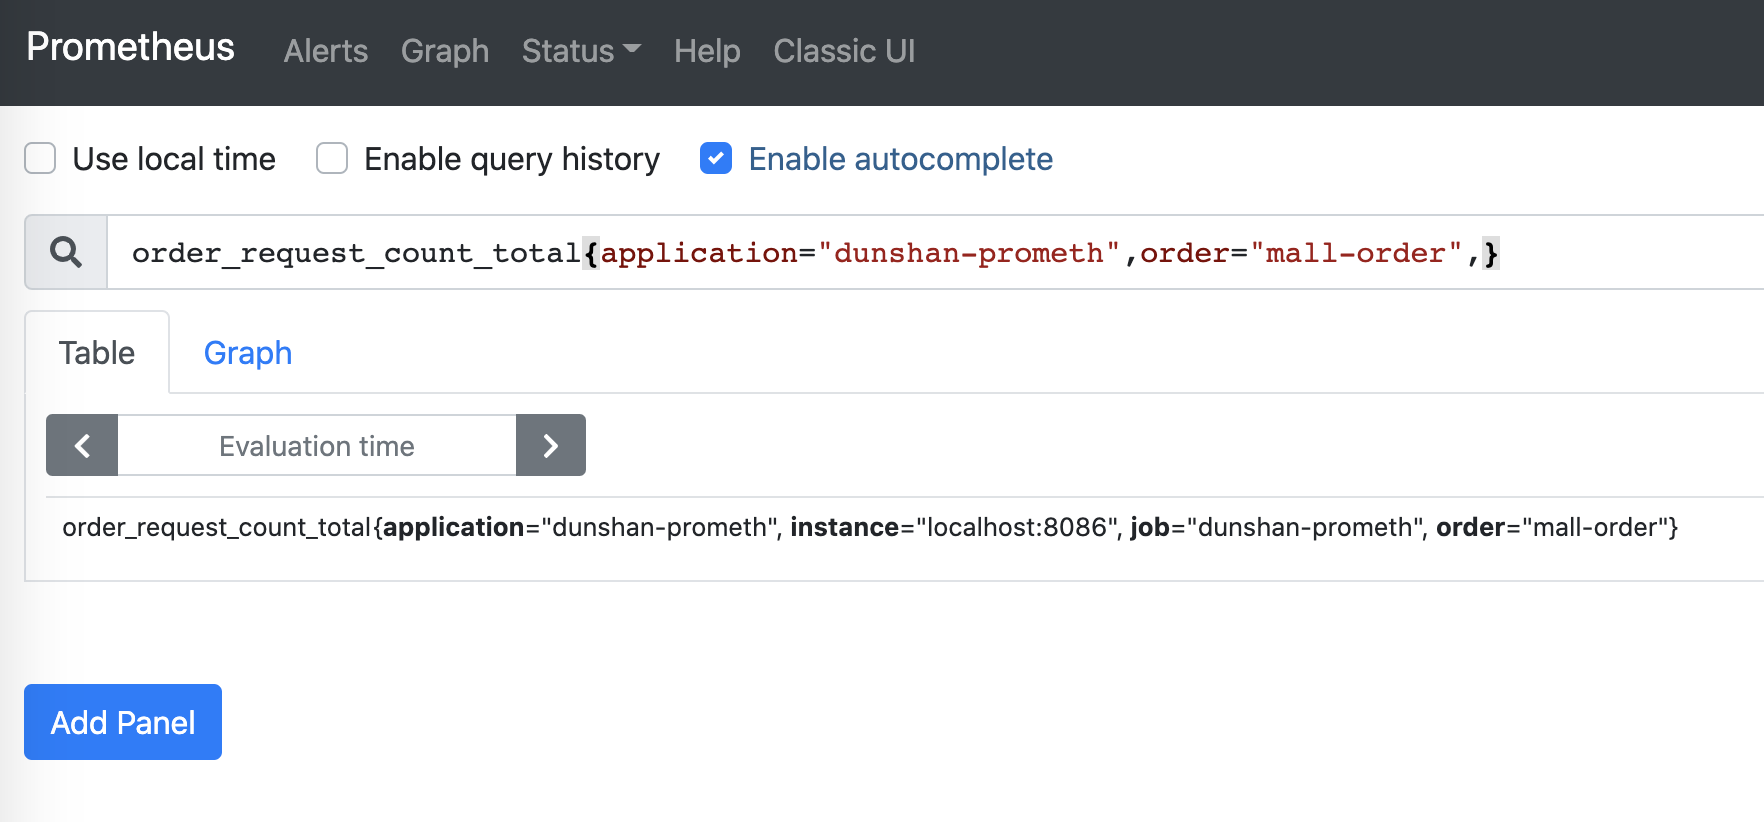
请求完成后,我们在 Prometheus 中查看 Metric 数据,如果数据显示正常,Prometheus TSDB 时序数据库就可以开始定时收集 Metric 数据了。
|
|
|
|
|
|
|
|
|
|
|
|
最后,我们只要在 Prometheus 控制台输入表达式语言 PromQL,就能查询 Metric 相关的数据了。
|
|
|
|
|
|
|
|
|
|
|
|
* 集成 Grafana 数据展示
|
|
|
|
|
|
表达式的结果可以通过多种形式展示,我们可以结合 Grafana 的控件将数据显示为图形或者表格,也可由外部系统通过 HTTP API 调用。这里我主要介绍一下通过集成 Grafana 做可视化数据展示的方法。
|
|
|
|
|
|
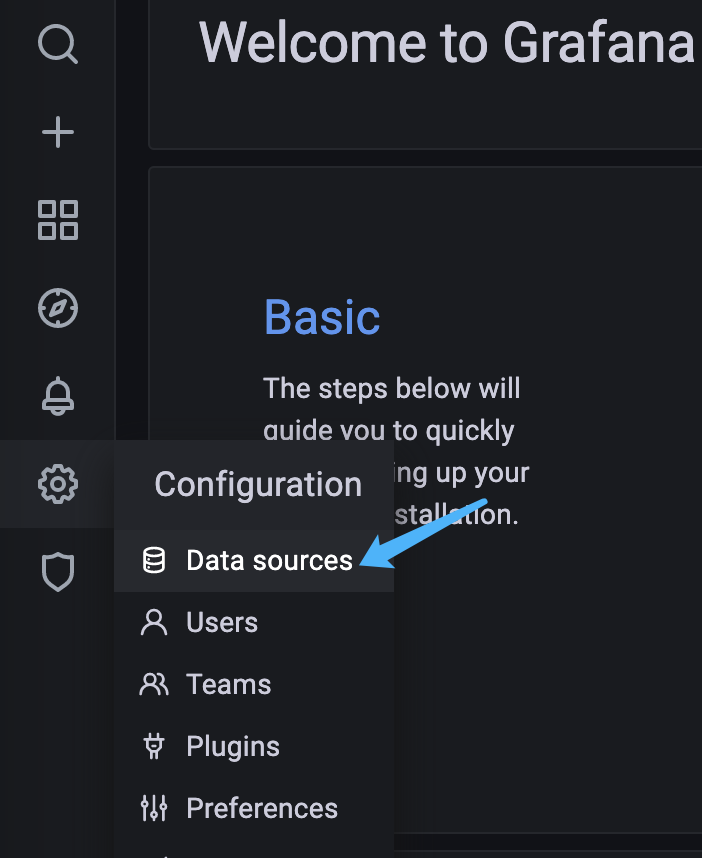
第一步,创建数据源:
|
|
|
|
|
|
|
|
|
|
|
|
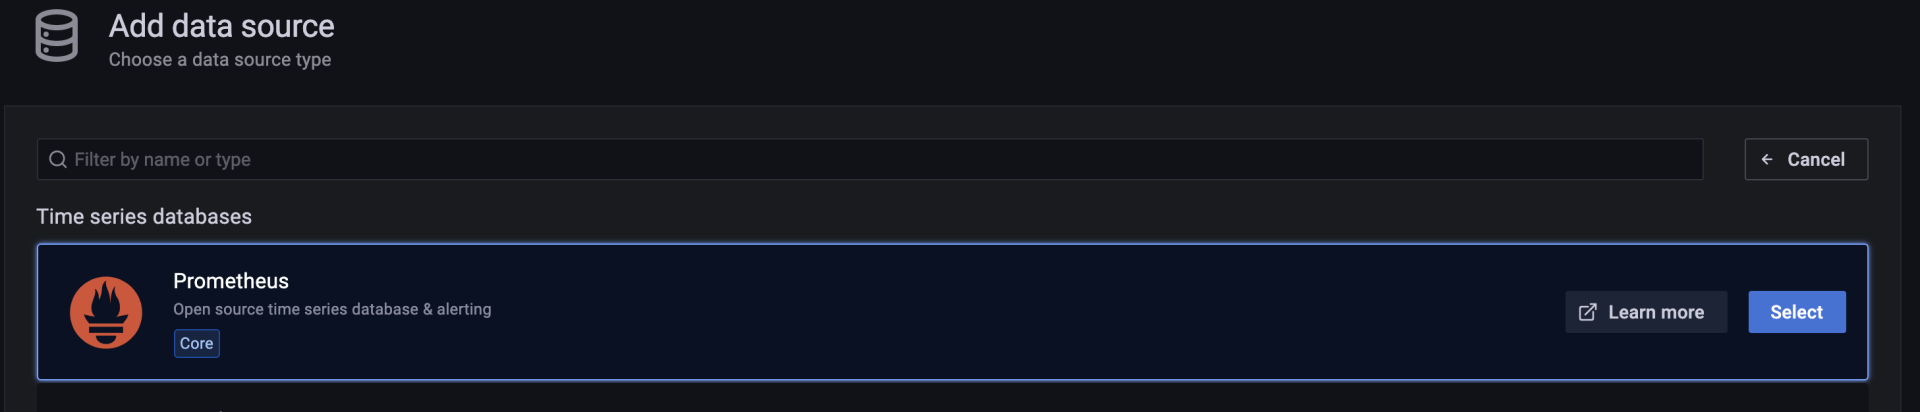
第二步,选择 Prometheus 数据源:
|
|
|
|
|
|
|
|
|
|
|
|
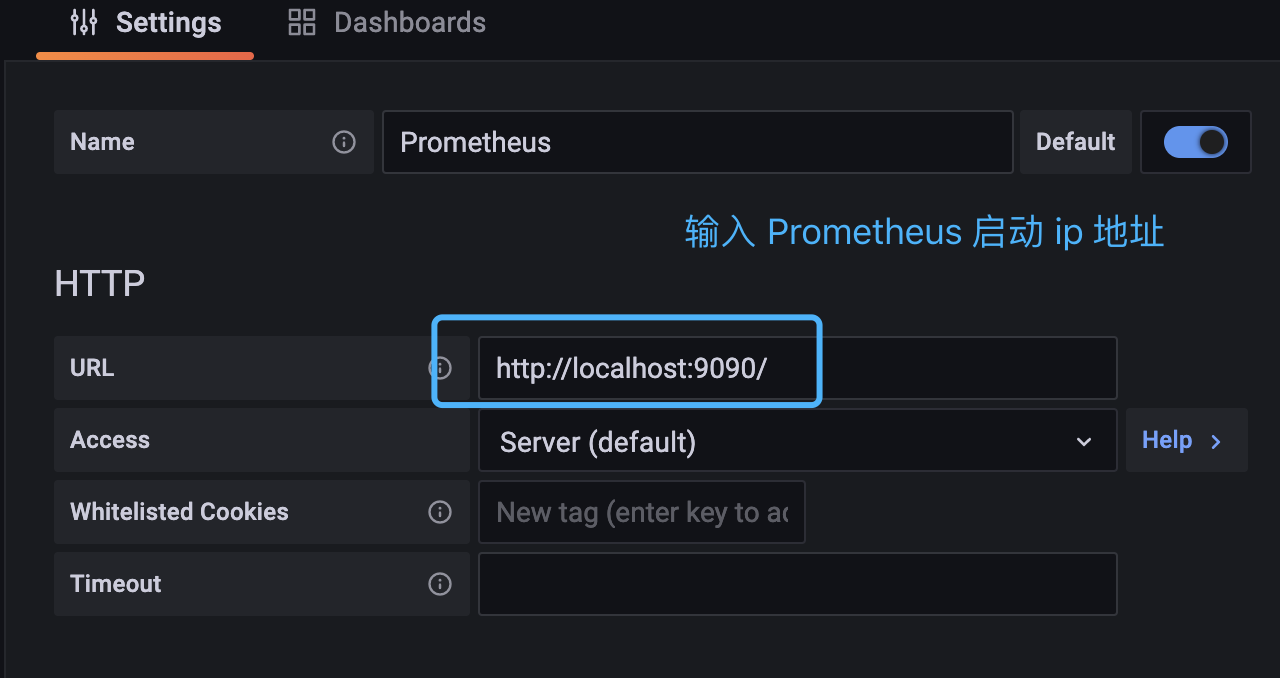
第三步,配置数据源地址:
|
|
|
|
|
|
|
|
|
|
|
|
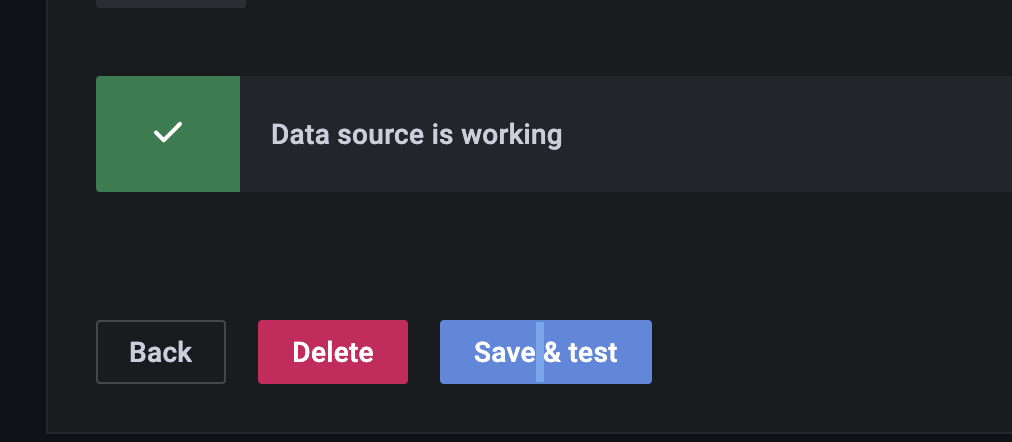
第四步,测试数据源是否配置成功:
|
|
|
|
|
|
|
|
|
|
|
|
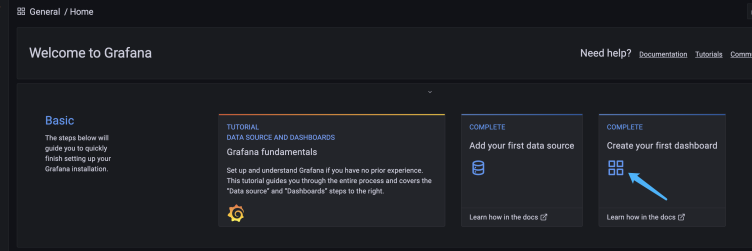
第五步,为了添加 Metrics 的图表,选择“创建第一个 dashboard”:
|
|
|
|
|
|
|
|
|
|
|
|
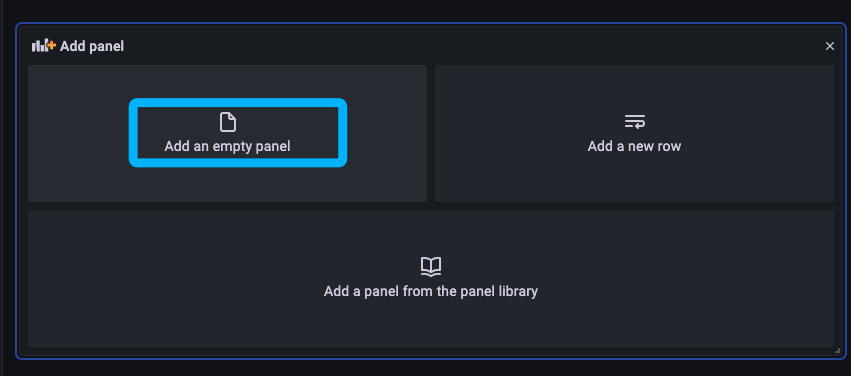
第六步,添加一个空面板:
|
|
|
|
|
|
|
|
|
|
|
|
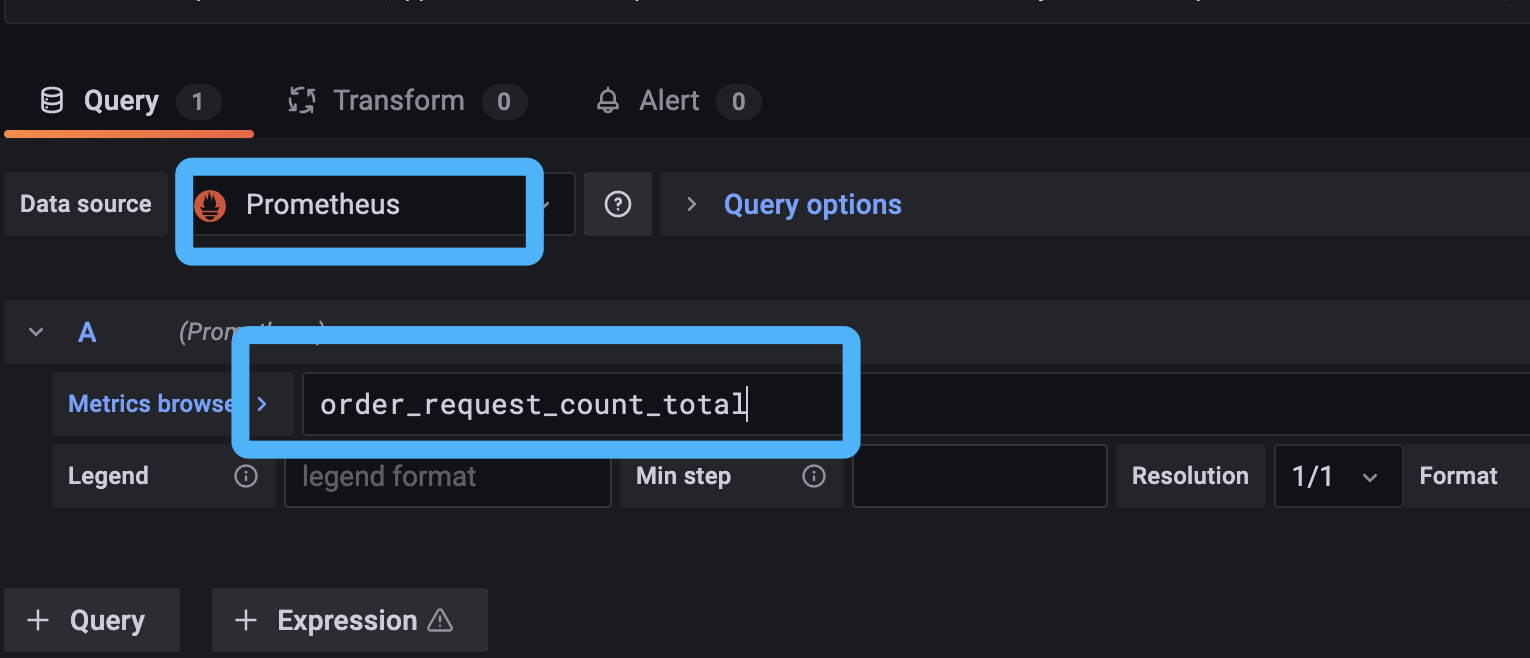
第七步,在 Data source 中选择 Prometheus 数据源,在 Metrics browser 中输入 Metric PromQL 表达式:
|
|
|
|
|
|
|
|
|
|
|
|
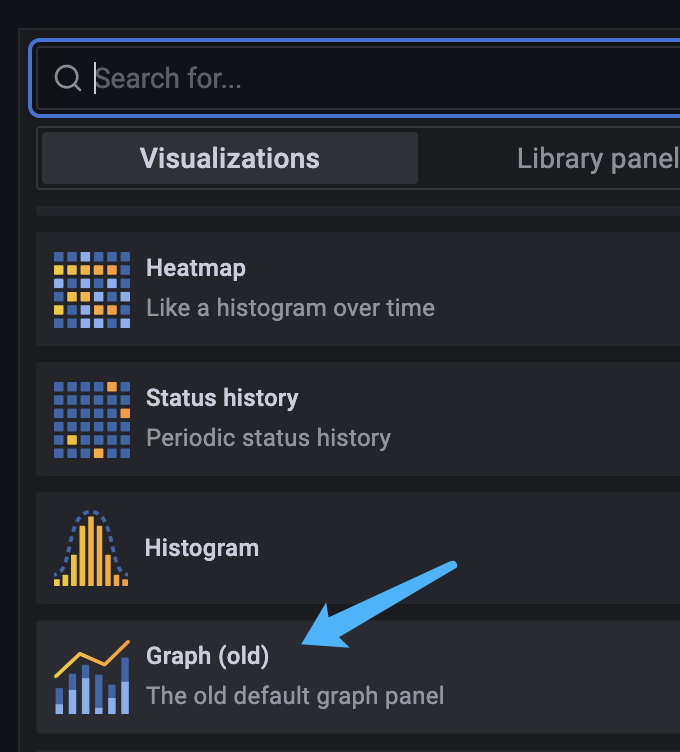
第八步,在右侧控件类型中选择图表控件:
|
|
|
|
|
|
|
|
|
|
|
|
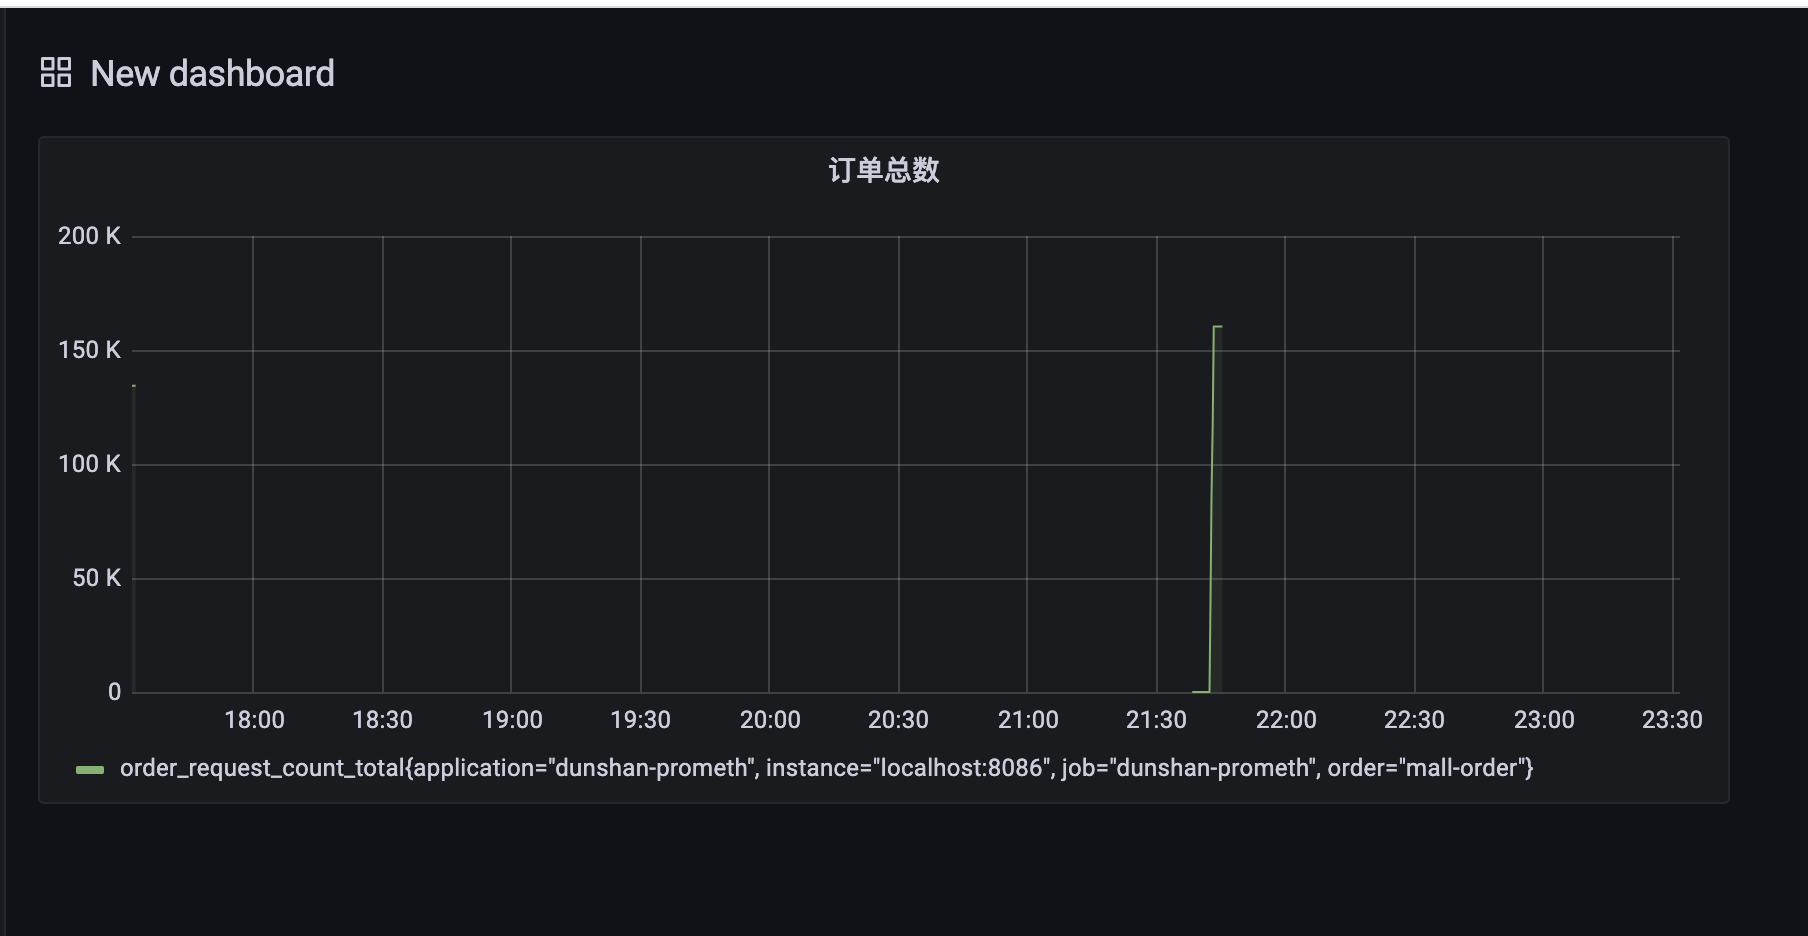
图表创建好之后,我们就可以看到 Metric 数据了。
|
|
|
|
|
|
|
|
|
|
|
|
因为需要展示不同的 Metrics,所以我们要重复上面的步骤,增加订单成功次数、订单失败次数、订单金额总数等 Metrics 绑定的图表。
|
|
|
|
|
|
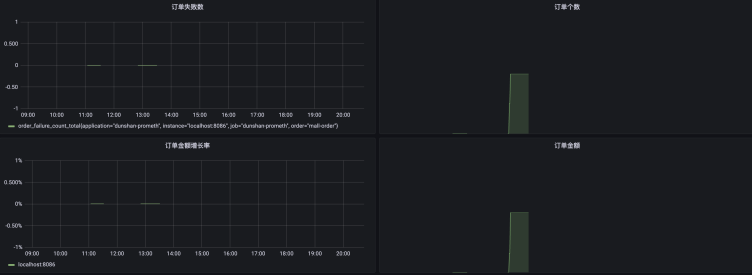
创建好的可视化看板你可以参考下面这张图:
|
|
|
|
|
|
|
|
|
|
|
|
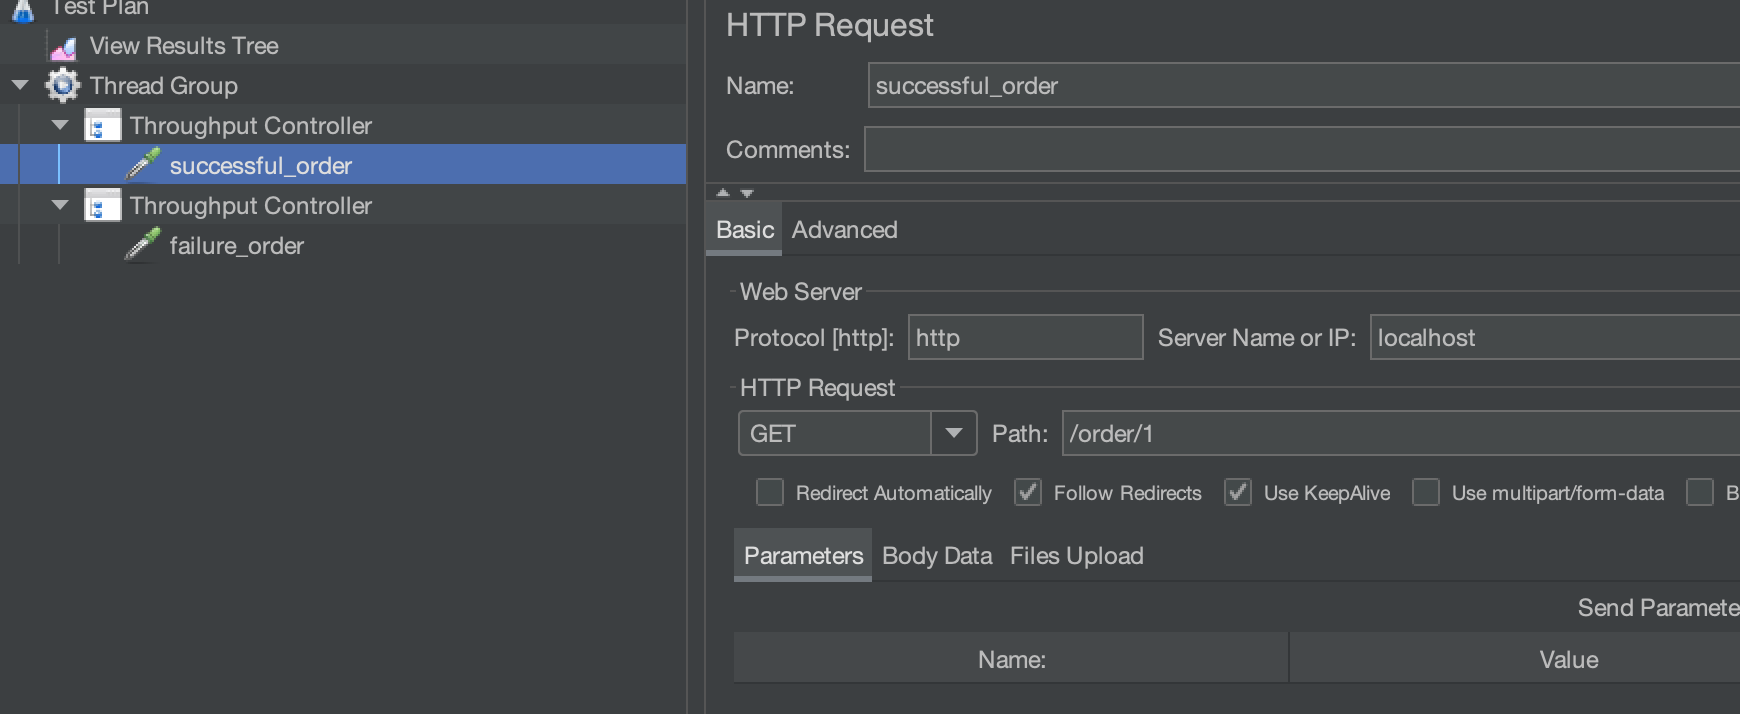
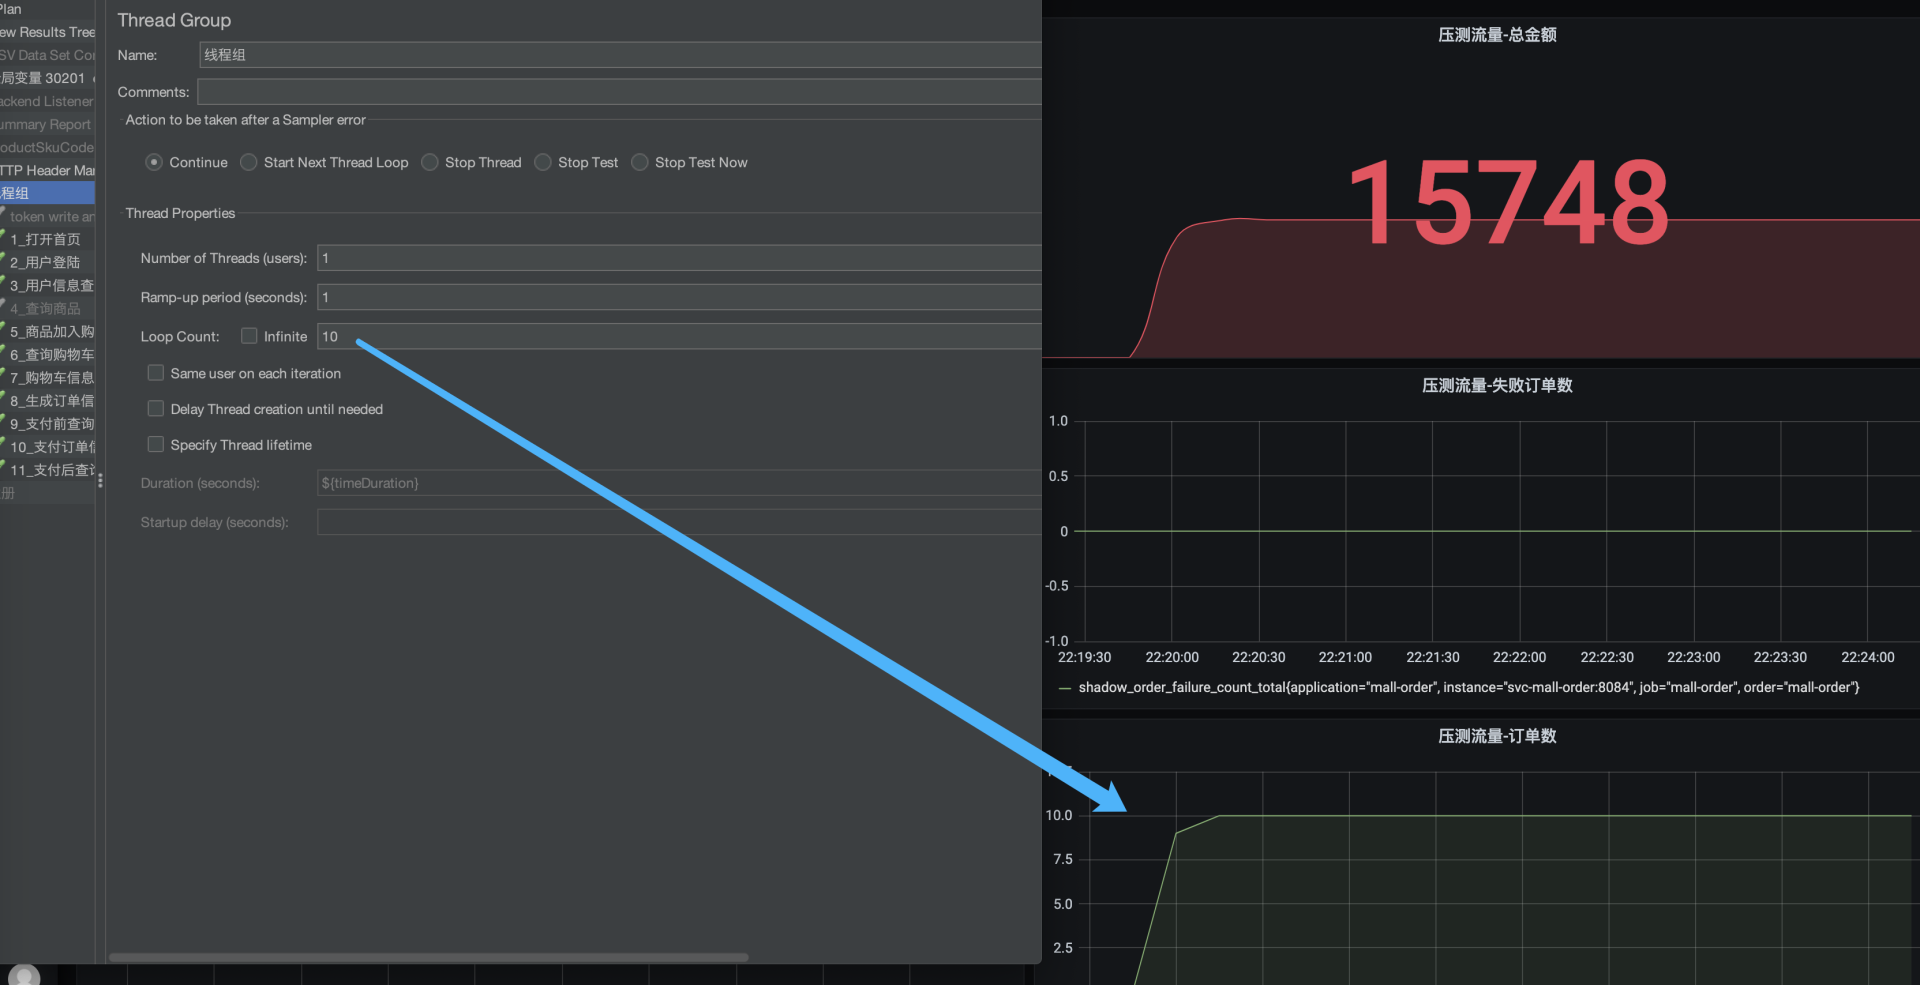
因为在添加可视化看板之前已经有过几次成功的订单,所以我们可以看到,上面已经有数据显示出来了。为了验证订单失败情况下 Metrics 数据是否能正常显示,我们还是使用 JMeter�模拟一下不同的业务情况(区分正确订单与失败订单),这样才能验证业务埋点是否成功。
|
|
|
|
|
|
我们使用 JMeter Throughput Controller 组件分配失败订单与成功订单的比例,脚本配置如下:
|
|
|
|
|
|
|
|
|
|
|
|
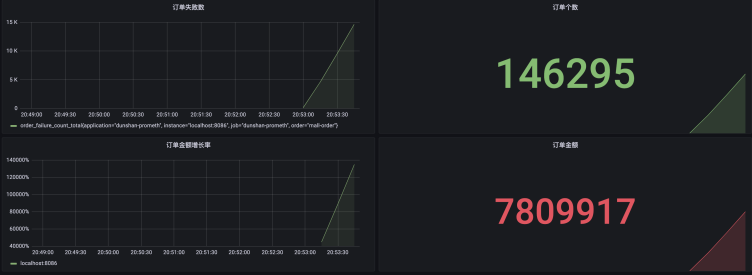
执行 JMeter 后,我们通过 Grafana 看板中显示的正常和失败订单的数据,可以知道 demo 的埋点已经成功了:
|
|
|
|
|
|
|
|
|
|
|
|
好了,刚才我们在 demo 技术预演项目中完成了业务模块的埋点工作,接下来就要开始真实系统的改造了。针对订单业务的数据,我们还是要用流量标记区分正常流量和压测流量,这样才能更精准地监控业务情况。当然啦,这也方便我们把这些 Metrics 数据提取出来,后续提供给管理层做决策。
|
|
|
|
|
|
## 真实系统改造
|
|
|
|
|
|
在对真实系统进行改造之前,我们先梳理一下订单类的代码逻辑,知道在哪里埋点是很重要的。
|
|
|
|
|
|
* 创建 Prometheus 数据的 Metric
|
|
|
|
|
|
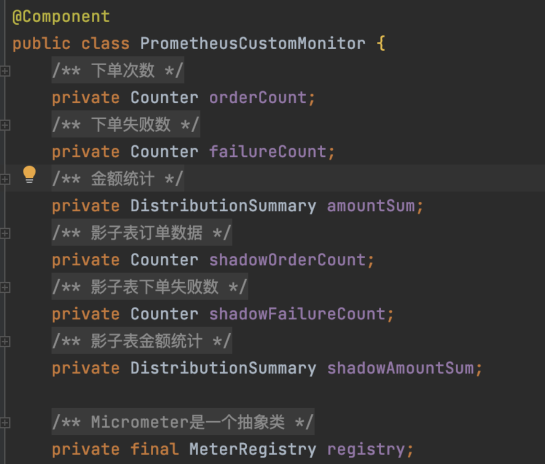
首先还是在项目中新增 Prometheus Metric 类:
|
|
|
|
|
|
```java
|
|
|
/**
|
|
|
* 下单次数
|
|
|
*/
|
|
|
private Counter orderCount;
|
|
|
/**
|
|
|
* 下单失败数
|
|
|
*/
|
|
|
private Counter failureCount;
|
|
|
/**
|
|
|
* 金额统计
|
|
|
*/
|
|
|
private DistributionSummary amountSum;
|
|
|
|
|
|
|
|
|
|
|
|
/**
|
|
|
* 影子表订单数据
|
|
|
*/
|
|
|
private Counter shadowOrderCount;
|
|
|
|
|
|
/**
|
|
|
* 影子表下单失败数
|
|
|
*/
|
|
|
private Counter shadowFailureCount;
|
|
|
/**
|
|
|
* 影子表金额统计
|
|
|
*/
|
|
|
private DistributionSummary shadowAmountSum;
|
|
|
|
|
|
|
|
|
|
|
|
/**
|
|
|
* Micrometer 是一个抽象类
|
|
|
*/
|
|
|
private final MeterRegistry registry;
|
|
|
|
|
|
|
|
|
|
|
|
|
|
|
|
|
|
@Autowired
|
|
|
public PrometheusCustomMonitor(MeterRegistry registry) {
|
|
|
this.registry = registry;
|
|
|
}
|
|
|
|
|
|
@PostConstruct
|
|
|
private void init() {
|
|
|
//统计下单数
|
|
|
orderCount = registry.counter("order_request_count", "order", "mall-order");
|
|
|
//统计失败数
|
|
|
failureCount = registry.counter("order_failure_count", "order", "mall-order");
|
|
|
//统计金额数据
|
|
|
amountSum = registry.summary("order_amount_sum", "orderAmount", "mall-order");
|
|
|
|
|
|
//影子表统计下单数
|
|
|
shadowOrderCount = registry.counter("shadow_order_request_count", "order", "mall-order");
|
|
|
//影子表统计失败数
|
|
|
shadowFailureCount = registry.counter("shadow_order_failure_count", "order", "mall-order");
|
|
|
//影子表统计金额数据
|
|
|
shadowAmountSum = registry.summary("shadow_order_amount_sum", "orderAmount", "mall-order");
|
|
|
|
|
|
|
|
|
|
|
|
}
|
|
|
public Counter getOrderCount() {
|
|
|
return orderCount;
|
|
|
}
|
|
|
|
|
|
public Counter getFailureCount() {
|
|
|
return failureCount;
|
|
|
}
|
|
|
|
|
|
public DistributionSummary getAmountSum() {
|
|
|
return amountSum;
|
|
|
}
|
|
|
|
|
|
public Counter getShadowOrderCount() {
|
|
|
return shadowOrderCount;
|
|
|
}
|
|
|
|
|
|
public Counter getShadowFailureCount() {
|
|
|
return shadowFailureCount;
|
|
|
}
|
|
|
|
|
|
public DistributionSummary getShadowAmountSum() {
|
|
|
return shadowAmountSum;
|
|
|
}
|
|
|
|
|
|
```
|
|
|
|
|
|
* 集成 Prometheus SDK
|
|
|
|
|
|
选择订单系统项目,在项目的 pom 文件中添加相关依赖:
|
|
|
|
|
|
```xml
|
|
|
<dependency>
|
|
|
<groupId>org.springframework.boot</groupId>
|
|
|
<artifactId>spring-boot-starter-actuator</artifactId>
|
|
|
</dependency>
|
|
|
<dependency>
|
|
|
<groupId>io.micrometer</groupId>
|
|
|
<artifactId>micrometer-registry-prometheus</artifactId>
|
|
|
</dependency>
|
|
|
|
|
|
```
|
|
|
|
|
|
* 注册定义好的业务 Metric
|
|
|
|
|
|
在代码中增加如下配置:
|
|
|
|
|
|
|
|
|
|
|
|
* 埋点到业务代码
|
|
|
|
|
|
接下来,我们开始梳理 mall-order 服务中生成订单类代码的逻辑。我们可以找到控制器接口代码:
|
|
|
|
|
|
```java
|
|
|
@ApiOperation("根据购物车信息生成订单")
|
|
|
@RequestMapping(value = "/generateOrder",method = RequestMethod.POST)
|
|
|
@ResponseBody
|
|
|
public CommonResult generateOrder(@RequestBody OrderParam orderParam) {
|
|
|
Map<String,Object> result = portalOrderService.generateOrder(orderParam);
|
|
|
return CommonResult.success(result, "下单成功");
|
|
|
}
|
|
|
|
|
|
```
|
|
|
|
|
|
**通过代码调用关系,我们可以很快找到 GenerateOrder 方法。业务 Metric 需要在这里埋点,以便收集 API 请求数据。**
|
|
|
|
|
|
```java
|
|
|
/**
|
|
|
* 根据提交信息生成订单
|
|
|
*/
|
|
|
@Override
|
|
|
public Map<String,Object> generateOrder(OrderParam orderParam) {
|
|
|
List<OmsOrderItem> orderItemList = new ArrayList<>();
|
|
|
//获取用户名
|
|
|
UmsMember currentMember = memberService.getCurrentMember();
|
|
|
//获取包含促销活动信息的购物车列表
|
|
|
List<CartPromotionItem> cartPromotionItemList = cartItemService.listPromotionnew(currentMember.getId(),orderParam.getCartIds());
|
|
|
|
|
|
.......
|
|
|
......
|
|
|
......
|
|
|
|
|
|
//发送延迟消息取消订单
|
|
|
sendDelayMessageCancelOrder(order.getId());
|
|
|
Map<String,Object> result = new HashMap<>();
|
|
|
result.put("order",order);
|
|
|
result.put("orderItemList",orderItemList);
|
|
|
logger.info("结果:" + JSON.toJSON(result));
|
|
|
return result;
|
|
|
}
|
|
|
|
|
|
```
|
|
|
|
|
|
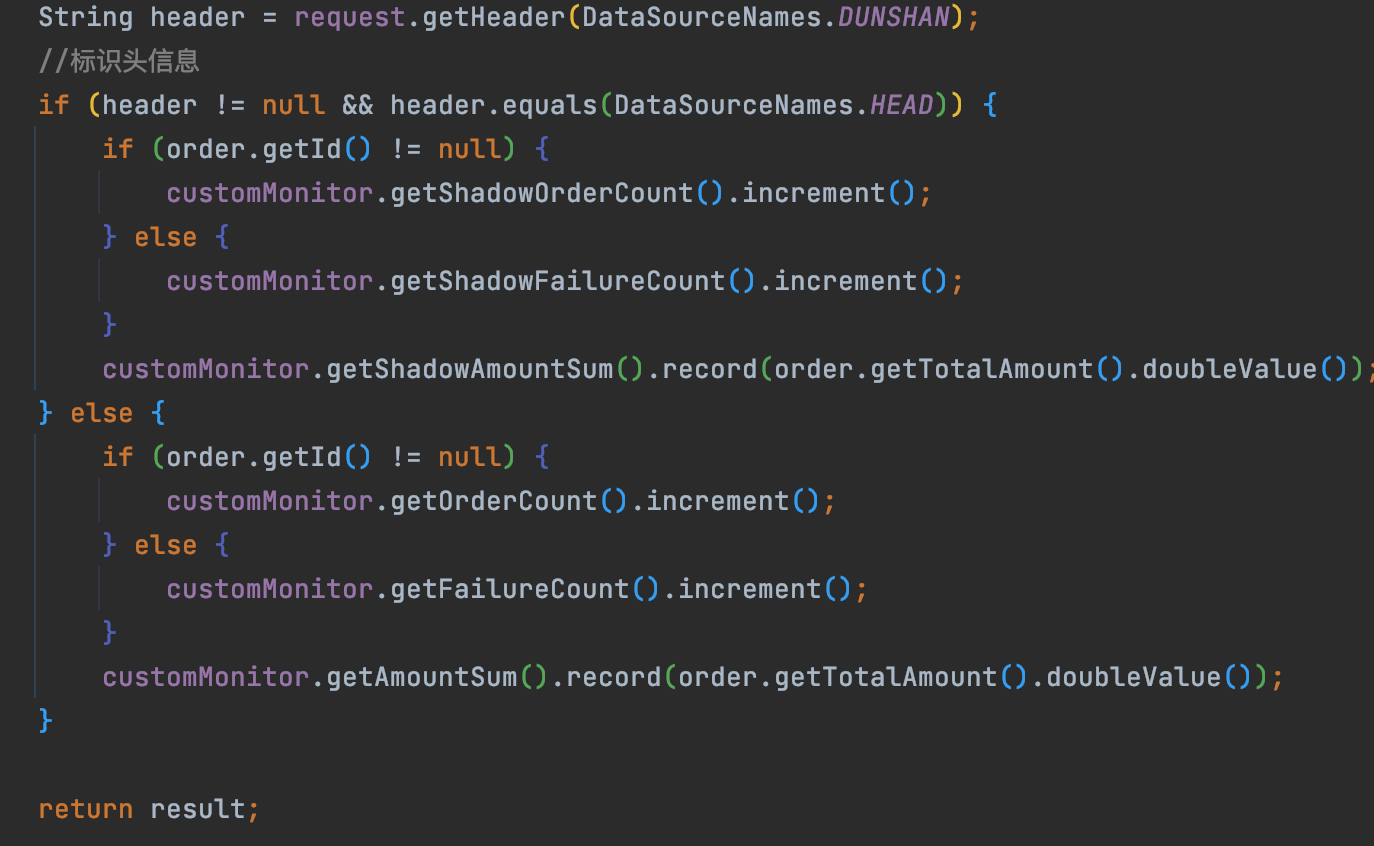
因为前面我们针对流量隔离进行系统改造的时候,已经区分了正常流量与压测流量,所以在具体进行业务埋点的时候,我们就需要根据 Header 标记区分不同流量来统计对应的 Metric。
|
|
|
|
|
|
这里我演示一下如何通过 HttpServletRequest 来获取 Header 标记来区分不同的流量(也可以使用 AOP 的方式)。参考代码如下:
|
|
|
|
|
|
|
|
|
|
|
|
好了,完成业务代码埋点之后,我们需要提供 Metrics 接口给 Prometheus TSDB 时序数据库收集数据。
|
|
|
|
|
|
* 公布业务 Metrics 访问路径
|
|
|
|
|
|
修改项目的全局配置文件,公布 Metrics 访问路径。具体配置如下:
|
|
|
|
|
|
|
|
|
|
|
|
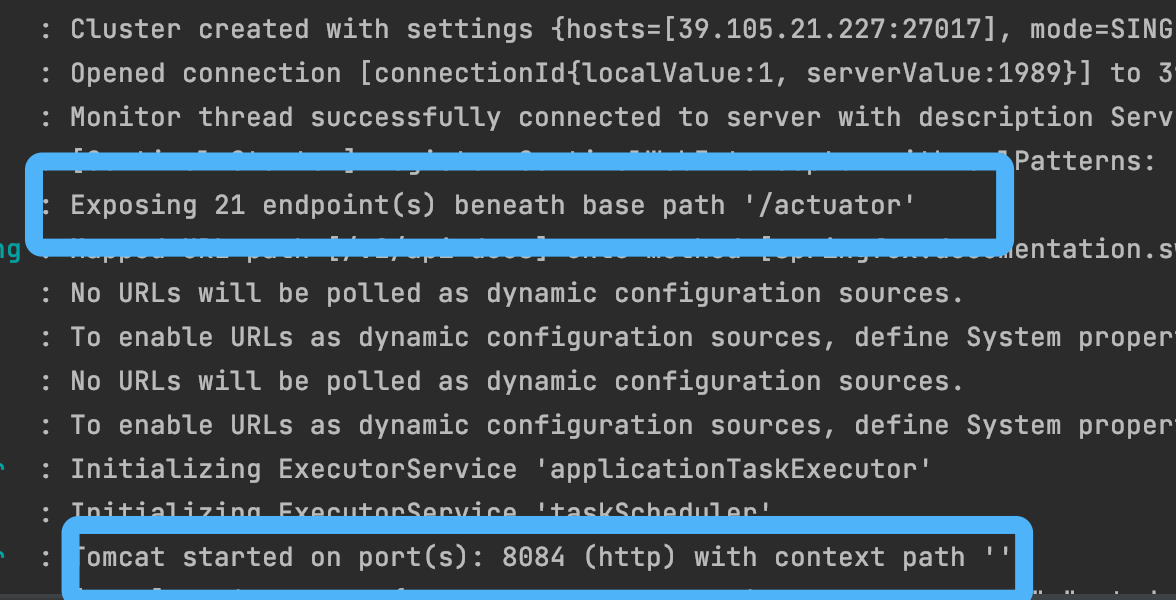
然后启动项目观察日志,发现已经有 actuator 对应的 URL 路径了。
|
|
|
|
|
|
|
|
|
|
|
|
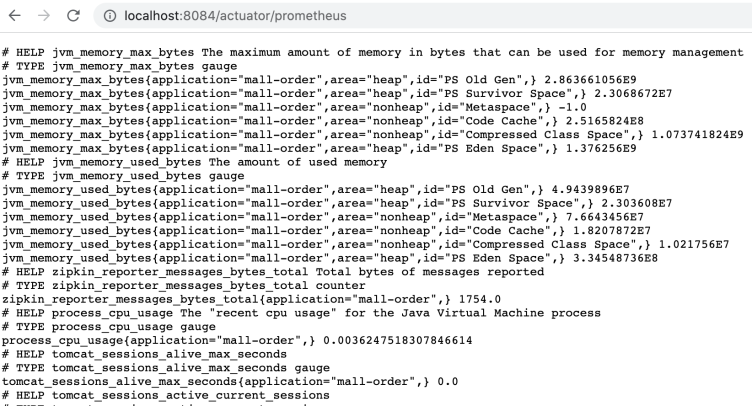
在浏览器中访问地址,可以看到,Metrics 数据就都已经显示出来了。
|
|
|
|
|
|
|
|
|
|
|
|
* 配置 Prometheus 拉取数据
|
|
|
|
|
|
配置 prometheus.yml 配置文件:
|
|
|
|
|
|
```yaml
|
|
|
- job_name: "dunshan-mall-order"
|
|
|
metrics_path: "/actuator/prometheus"
|
|
|
static_configs:
|
|
|
- targets: ["localhost:8084"]
|
|
|
|
|
|
```
|
|
|
|
|
|
文件配置好之后,我们重启 Prometheus,参考命令如下:
|
|
|
|
|
|
```bash
|
|
|
$ brew services restart prometheus
|
|
|
Stopping `prometheus`... (might take a while)
|
|
|
==> Successfully stopped `prometheus` (label: homebrew.mxcl.prometheus)
|
|
|
==> Successfully started `prometheus` (label: homebrew.mxcl.prometheus)
|
|
|
|
|
|
```
|
|
|
|
|
|
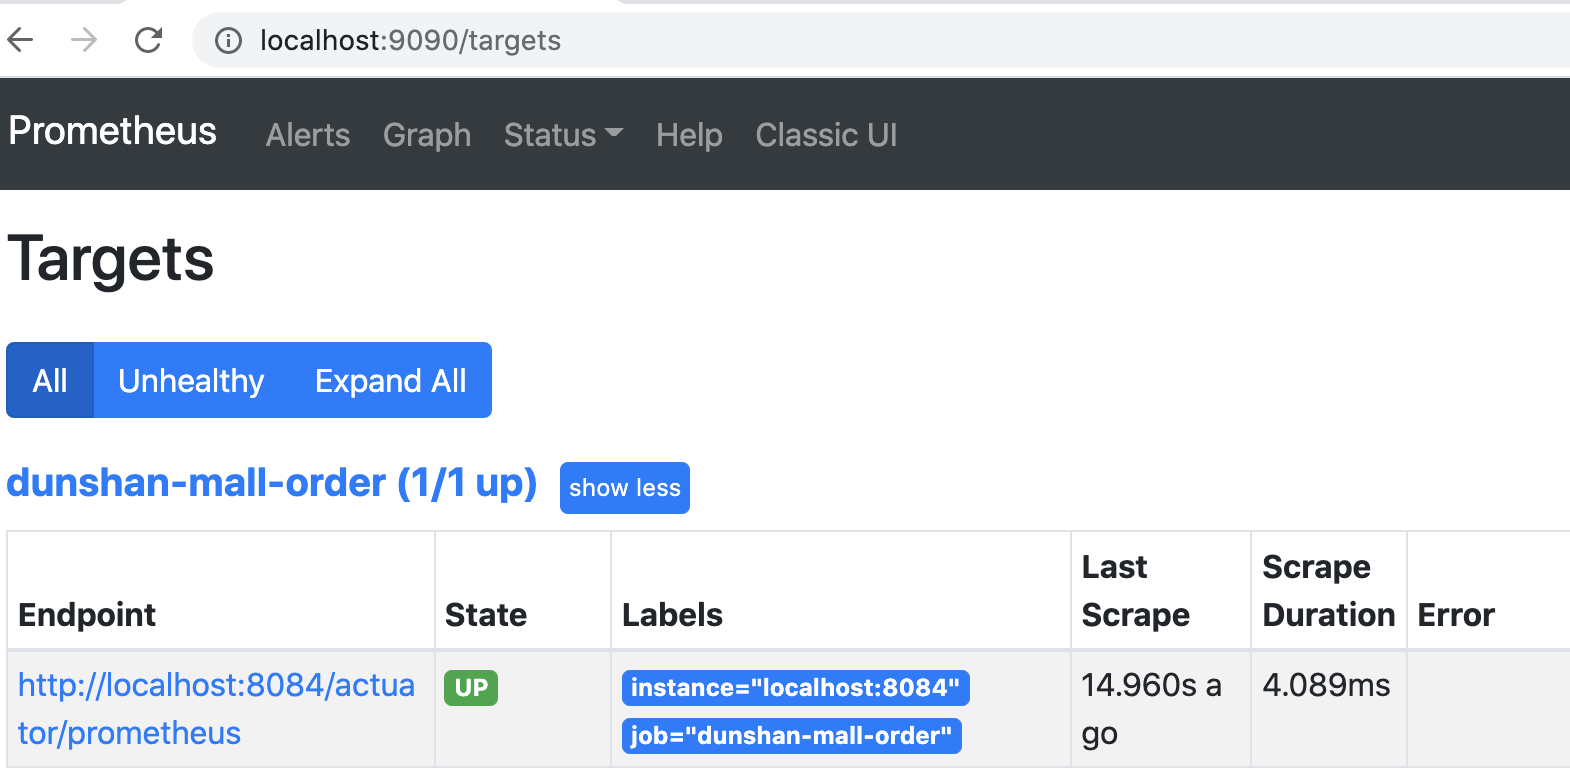
打开 Prometheus 控制台,可以看到,显示的 metrics\_path 和我们预期的一致。
|
|
|
|
|
|
|
|
|
|
|
|
到这里,我们就把订单系统、业务 Metrics 和 Prometheus 监控系统打通了。做完这些我们的任务就完成 80%了,最后一步就是集成 Grafana ,这样才能做到酷炫的可视化数据展示。
|
|
|
|
|
|
* 集成 Grafana 可视化看板
|
|
|
|
|
|
现在只要打开 Grafana,添加自定义图表绑定 Metrics 即可。
|
|
|
|
|
|
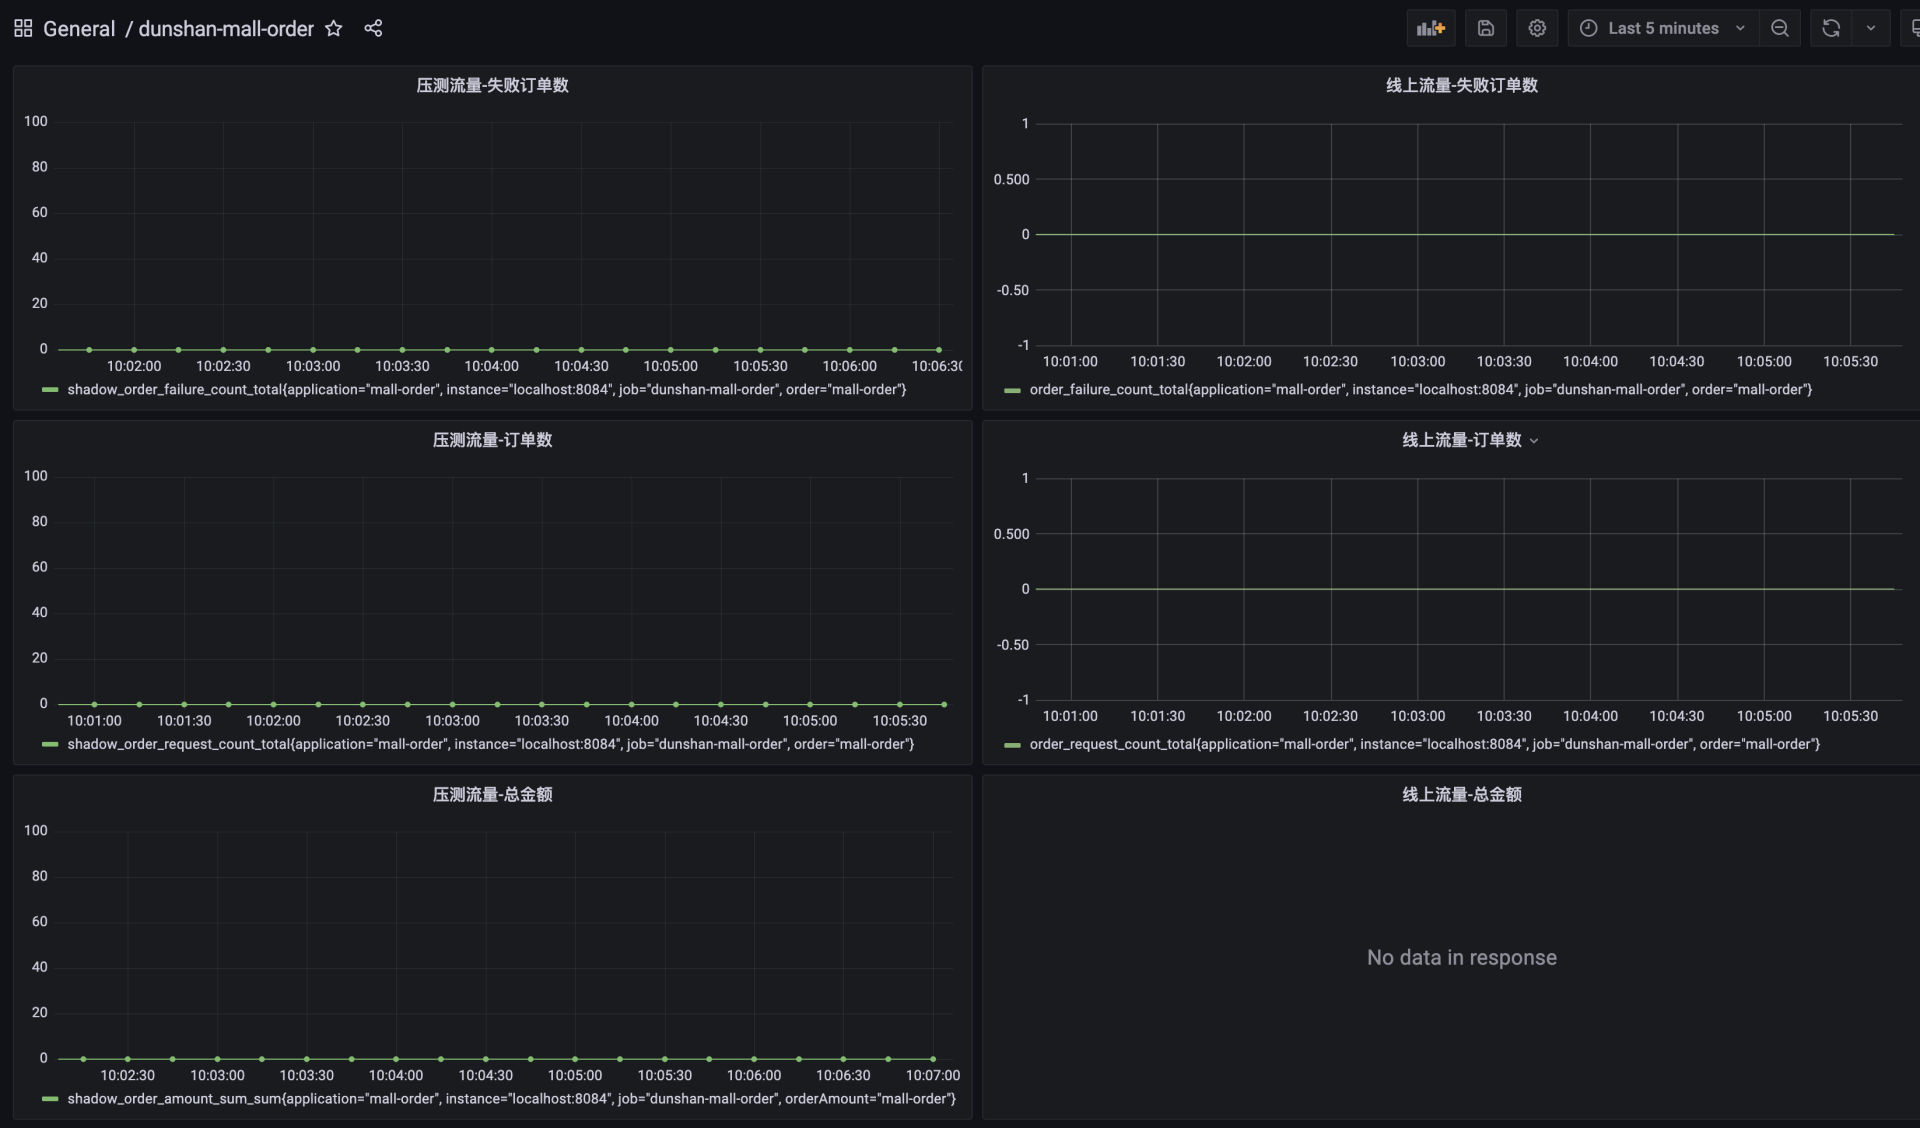
你可以参考下面的运行效果图和最终效果图:
|
|
|
|
|
|
|
|
|
|
|
|
|
|
|
|
|
|
好了,到这里我们的真实系统改造就完成了。
|
|
|
|
|
|
## 总结
|
|
|
|
|
|
这节课,我们介绍了结合 Prometheus SDK 对 Java 应用的业务埋点改造,我还对这部分细节做了详细的演示。希望可以让你在选择业务级定向监控解决方案时有一些参考。
|
|
|
|
|
|
通过这节课的学习,我们知道了使用 Prometheus 可以快速搭建监控服务,它还能够非常方便地在应用程序中进行集成。Prometheus允许我们通过多种语言的 SDK 进行应用程序的数据埋点。基于这些 SDK ,我们可以让应用程序快速纳入到 Prometheus 的监控或者开发者自己的监控数据收集程序当中。同时,这些客户端收集的监控数据,不仅仅支持 Prometheus,还能支持其他的监控工具。从实现的难度上来说,这节课不算太复杂,只要有一点代码功底都可以实现,但这却是非常重要的部分。
|
|
|
|
|
|
我们做性能工作的人经常不擅长用好理解的方式表达业务上的数据,当我们去说 TPS、响应时间、吞吐量、CPU 使用率等测试指标或技术指标时,对非技术行业的业务人员和领导们来说,他们很难理解,也不会有直观的感受。但是如果你说,我们一小时可以处理 2000 万笔下单操作,他们马上就能明白了。这也是我希望借助这节课的内容达到的效果。
|
|
|
|
|
|
做技术工作的时候,你可以非常细致,但是在和不同团队、不同职位的人沟通的时候,我建议你一定要从对方的角度来思考问题,说对方听得懂的话,这样才能让性能工作的价值体现出来。
|
|
|
|
|
|
## 思考题
|
|
|
|
|
|
学完今天的课程,请你思考下面两个问题:
|
|
|
|
|
|
1. 业务级的定向监控一般会监控哪些 Metrics?你们公司有没有相应的方法来进行监控?
|
|
|
2. 前面,我们还提到了可以用 AOP 埋点收集数据,但是我并没有给出具体的示例。你知道怎么实现吗?
|
|
|
|
|
|
欢迎你在留言区与我交流讨论。当然了,你也可以把这节课分享给你身边的朋友,他们的一些想法或许会让你有更大的收获。我们下节课见!
|
|
|
|