|
|
|
|
|
# 12 | 链路追踪:如何对一个具体的项目进行追踪改造?
|
|
|
|
|
|
|
|
|
|
|
|
你好,我是高楼。
|
|
|
|
|
|
|
|
|
|
|
|
在上一讲,我给你梳理了链路追踪的背景、目标、几种常见的组件,我们还确定了系统最后的选型方案。
|
|
|
|
|
|
|
|
|
|
|
|
在这一讲,我会通过案例演示在应用 Sleuth+Zipkin 来追踪我们电商微服务项目请求的过程中,需要关注的一些技术细节。
|
|
|
|
|
|
|
|
|
|
|
|
首先,我们来回顾一下电商项目集成 Sleuth+ Zipkin 的应用架构。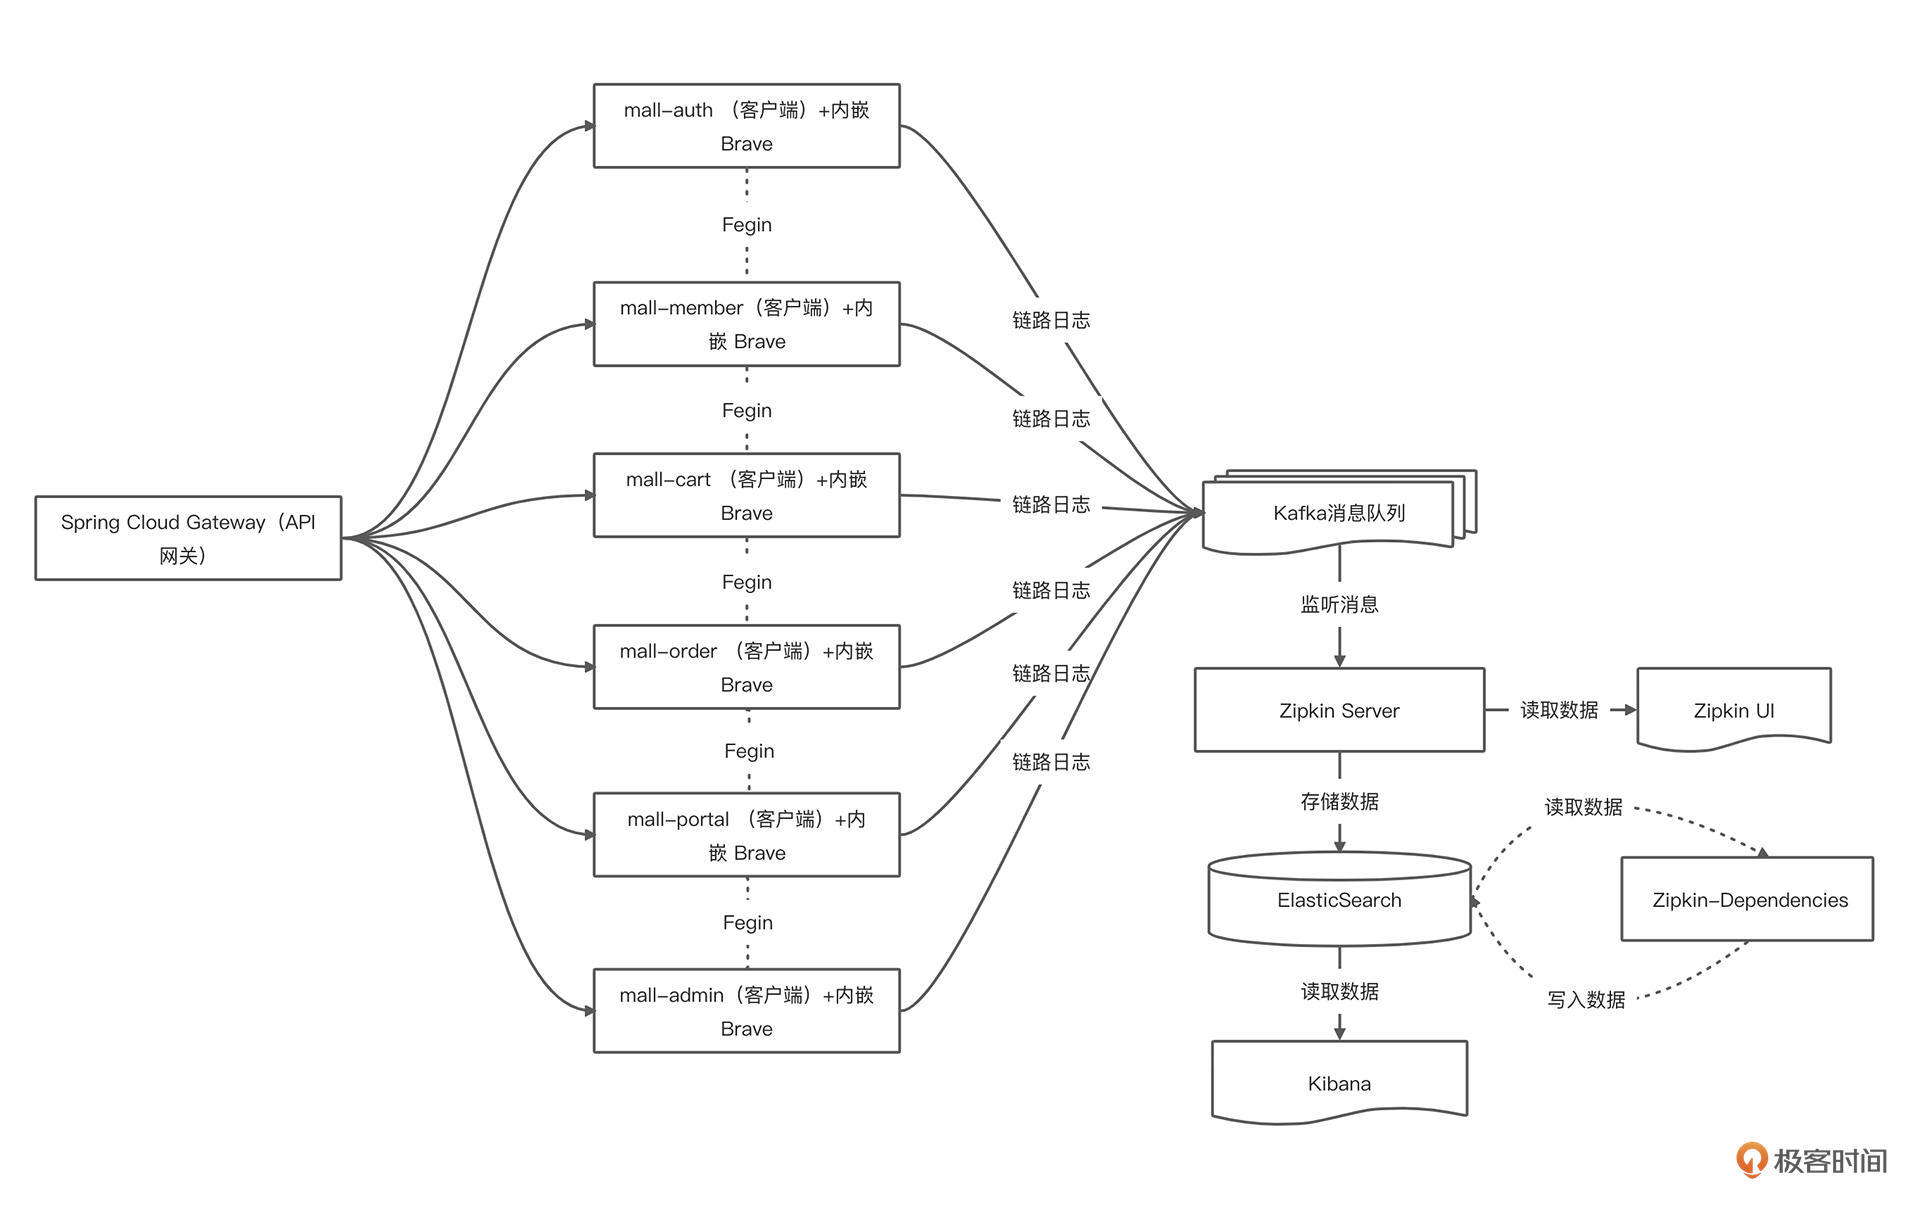
|
|
|
|
|
|
|
|
|
|
|
|
系统涉及的需要新增或改造的服务与组件包含以下 10 个:
|
|
|
|
|
|
|
|
|
|
|
|
1. Zipkin,链路追踪系统
|
|
|
|
|
|
2. Kafka,消息队列
|
|
|
|
|
|
3. ElasticSearch,搜索引擎
|
|
|
|
|
|
4. mall-gateway,API 网关
|
|
|
|
|
|
5. mall-auth,认证中心服务
|
|
|
|
|
|
6. mall-member,会员系统服务
|
|
|
|
|
|
7. mall-order,订单系统服务
|
|
|
|
|
|
8. mall-cart,购物车系统服务
|
|
|
|
|
|
9. mall-protal,商城后台系统服务
|
|
|
|
|
|
10. mall-admin,后台管理系统服务
|
|
|
|
|
|
|
|
|
|
|
|
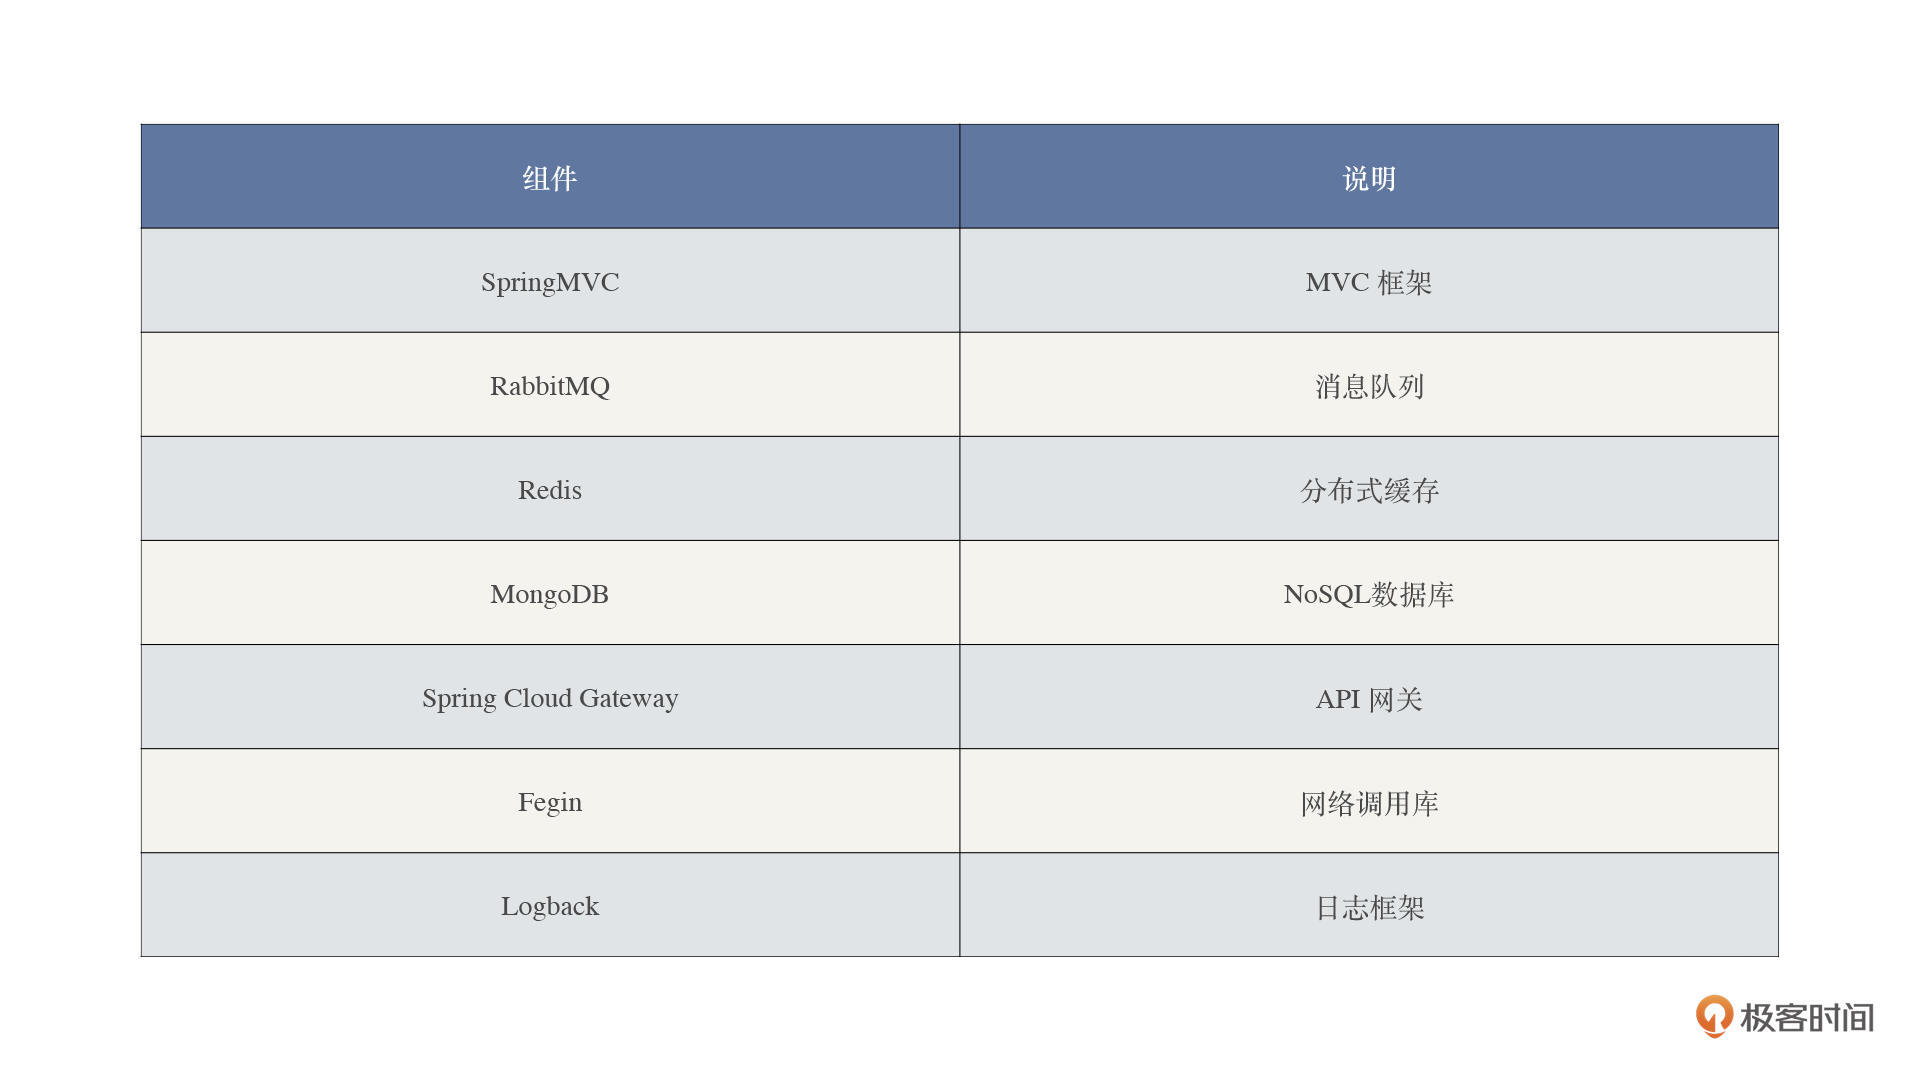
结合技术栈,可以得出下面这张表格。表格整合了涉及追踪的技术组件,可以指导我们后续的改造工作。
|
|
|
|
|
|
|
|
|
|
|
|
|
|
|
|
|
|
|
|
|
|
|
|
接下来,我们通过 Demo 预演来一一做一下组件追踪的技术验证工作。
|
|
|
|
|
|
|
|
|
|
|
|
## demo 预演
|
|
|
|
|
|
|
|
|
|
|
|
### SpringMVC、Fegin、Logback
|
|
|
|
|
|
|
|
|
|
|
|
一般而言,我们使用 [Brave](https://github.com/openzipkin/brave) 库,作为 Zipkin 客户端。同时它的 [instrumentation](https://github.com/openzipkin/brave/tree/master/instrumentation) 子项目,已经提供了 SpringMVC、Fegin 等组件的链路追踪功能。
|
|
|
|
|
|
|
|
|
|
|
|
所以通过引入 Spring Cloud Sleuth + Zipkin 相关依赖,可以实现对它们的自动配置,从而实现链路追踪的功能。
|
|
|
|
|
|
|
|
|
|
|
|
```xml
|
|
|
|
|
|
<!--添加 Sleuth 依赖 -->
|
|
|
|
|
|
<dependency>
|
|
|
|
|
|
<groupId>org.springframework.cloud</groupId>
|
|
|
|
|
|
<artifactId>spring-cloud-starter-sleuth</artifactId>
|
|
|
|
|
|
<version>2.2.6.RELEASE</version>
|
|
|
|
|
|
</dependency>
|
|
|
|
|
|
<!--Zipkin 客户端-->
|
|
|
|
|
|
<dependency>
|
|
|
|
|
|
<groupId>org.springframework.cloud</groupId>
|
|
|
|
|
|
<artifactId>spring-cloud-starter-zipkin</artifactId>
|
|
|
|
|
|
<version>2.2.6.RELEASE</version>
|
|
|
|
|
|
</dependency>
|
|
|
|
|
|
|
|
|
|
|
|
```
|
|
|
|
|
|
|
|
|
|
|
|
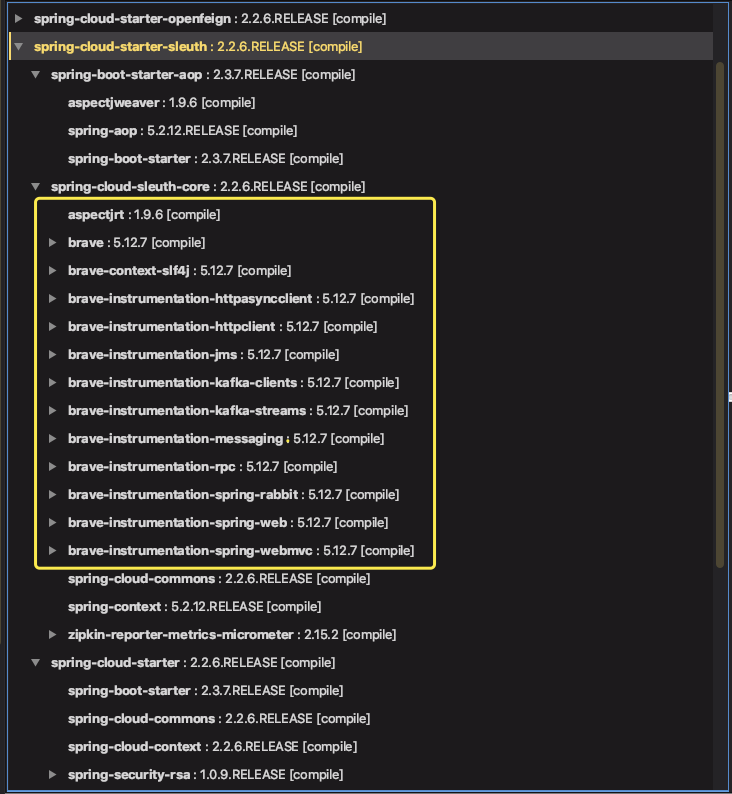
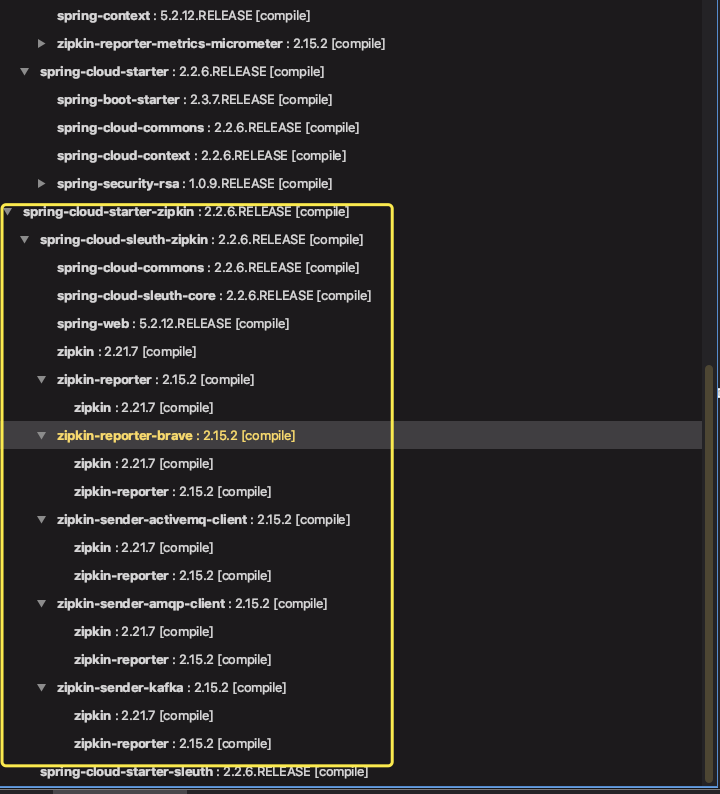
从我给出的截图可以看出,已经成功引入 Zipkin、Sleuth 和 Brave 相关的依赖。
|
|
|
|
|
|
|
|
|
|
|
|
|
|
|
|
|
|
|
|
|
|
|
|
|
|
|
|
|
|
|
|
|
|
|
|
具体的示例,你可以参考这篇文章: [Sleuth+Zipkin 实现 Spring Cloud 链路追踪](https://mp.weixin.qq.com/s/7Xqk_1xGlLZom9hkfyW9hg) 。
|
|
|
|
|
|
|
|
|
|
|
|
最后,Zipkin 可视化 UI 会出现对应的链路调用图及详细的链路。
|
|
|
|
|
|
|
|
|
|
|
|
|
|
|
|
|
|
|
|
|
|
|
|
### Spring Cloud Gateway
|
|
|
|
|
|
|
|
|
|
|
|
因为 [Brave](https://github.com/openzipkin/brave) 库默认提供了 Gateway 链路追踪的功能,所以要想实现 Sleuth 对 [Spring Cloud Gateway](https://spring.io/projects/spring-cloud-gateway) 的代理请求的链路追踪,我们只需要集成就可以了。
|
|
|
|
|
|
|
|
|
|
|
|
这里我们结合上面示例中的三个服务,实现一个 API 网关,转发请求到 A 服务,即 Gateway -> A -> B -> C,各服务间通过 Fegin 实现远程调用。
|
|
|
|
|
|
|
|
|
|
|
|
注意,Spring Cloud Gateway 是基于 [WebFlux](https://docs.spring.io/spring-framework/docs/current/reference/html/web-reactive.html) 实现的,而 Spring Cloud Sleuth 的 [instrument/web](https://github.com/spring-cloud/spring-cloud-sleuth/blob/master/spring-cloud-sleuth-core/src/main/java/org/springframework/cloud/sleuth/instrument/web/) 模块提供的插件,实际是针对 WebFlux 框架,同样也适用于 Spring Cloud Gateway。
|
|
|
|
|
|
|
|
|
|
|
|
具体操作如下:
|
|
|
|
|
|
|
|
|
|
|
|
第一步,创建 pom.xml 文件,引入相关依赖。
|
|
|
|
|
|
|
|
|
|
|
|
```xml
|
|
|
|
|
|
<dependencies>
|
|
|
|
|
|
<!-- 引入 Spring Cloud Gateway 相关依赖,使用它作为网关,并实现对其的自动配置 -->
|
|
|
|
|
|
<dependency>
|
|
|
|
|
|
<groupId>org.springframework.cloud</groupId>
|
|
|
|
|
|
<artifactId>spring-cloud-starter-gateway</artifactId>
|
|
|
|
|
|
</dependency>
|
|
|
|
|
|
<!-- 引入 Zipkin 依赖-->
|
|
|
|
|
|
<dependency>
|
|
|
|
|
|
<groupId>org.springframework.cloud</groupId>
|
|
|
|
|
|
<artifactId>spring-cloud-starter-zipkin</artifactId>
|
|
|
|
|
|
</dependency>
|
|
|
|
|
|
<!--添加 Sleuth 依赖 -->
|
|
|
|
|
|
<dependency>
|
|
|
|
|
|
<groupId>org.springframework.cloud</groupId>
|
|
|
|
|
|
<artifactId>spring-cloud-starter-sleuth</artifactId>
|
|
|
|
|
|
</dependency>
|
|
|
|
|
|
</dependencies>
|
|
|
|
|
|
|
|
|
|
|
|
```
|
|
|
|
|
|
|
|
|
|
|
|
第二步,在 application.yml 中,添加服务路由相关配置。
|
|
|
|
|
|
|
|
|
|
|
|
```yaml
|
|
|
|
|
|
server:
|
|
|
|
|
|
port: 8888
|
|
|
|
|
|
|
|
|
|
|
|
spring:
|
|
|
|
|
|
application:
|
|
|
|
|
|
name: demo-gateway-application
|
|
|
|
|
|
sleuth:
|
|
|
|
|
|
sampler: #采样器
|
|
|
|
|
|
probability: 1.0 #采样率,采样率是采集 Trace 的比率,默认 0.1
|
|
|
|
|
|
rate: 10000 #每秒数据采集量,最多 n 条/秒 Trace
|
|
|
|
|
|
web: # Web 组件的配置项,例如说 SpringMVC
|
|
|
|
|
|
enabled: true
|
|
|
|
|
|
zipkin: #设置 zipkin 服务端地址
|
|
|
|
|
|
base-url: http://127.0.0.1:9411
|
|
|
|
|
|
|
|
|
|
|
|
cloud:
|
|
|
|
|
|
# Spring Cloud Gateway 配置项,对应 GatewayProperties 类
|
|
|
|
|
|
gateway:
|
|
|
|
|
|
# 路由配置项,对应 RouteDefinition 数组
|
|
|
|
|
|
routes:
|
|
|
|
|
|
- id: feign-service-route
|
|
|
|
|
|
uri: http://127.0.0.1:7000
|
|
|
|
|
|
predicates:
|
|
|
|
|
|
- Path=/**
|
|
|
|
|
|
|
|
|
|
|
|
```
|
|
|
|
|
|
|
|
|
|
|
|
因为使用的是 [instrument/web](https://github.com/spring-cloud/spring-cloud-sleuth/blob/master/spring-cloud-sleuth-core/src/main/java/org/springframework/cloud/sleuth/instrument/web/) 模块提供的插件,所以和 SpringMVC 一样,WebFlux 也是使用 spring.sleuth.web 配置项。
|
|
|
|
|
|
|
|
|
|
|
|
配置项中,我们创建了一个编号为 feign-service-route 的路由,转发到 a-service 服务。
|
|
|
|
|
|
|
|
|
|
|
|
第三步,网关启动类。
|
|
|
|
|
|
|
|
|
|
|
|
```java
|
|
|
|
|
|
package com.dunshan.gatewaydemo;
|
|
|
|
|
|
import org.springframework.boot.SpringApplication;
|
|
|
|
|
|
import org.springframework.boot.autoconfigure.SpringBootApplication;
|
|
|
|
|
|
/**
|
|
|
|
|
|
* @author dunshan
|
|
|
|
|
|
*/
|
|
|
|
|
|
@SpringBootApplication
|
|
|
|
|
|
public class GatewayApplication {
|
|
|
|
|
|
public static void main(String[] args) {
|
|
|
|
|
|
SpringApplication.run(GatewayApplication.class, args);
|
|
|
|
|
|
}
|
|
|
|
|
|
}
|
|
|
|
|
|
|
|
|
|
|
|
```
|
|
|
|
|
|
|
|
|
|
|
|
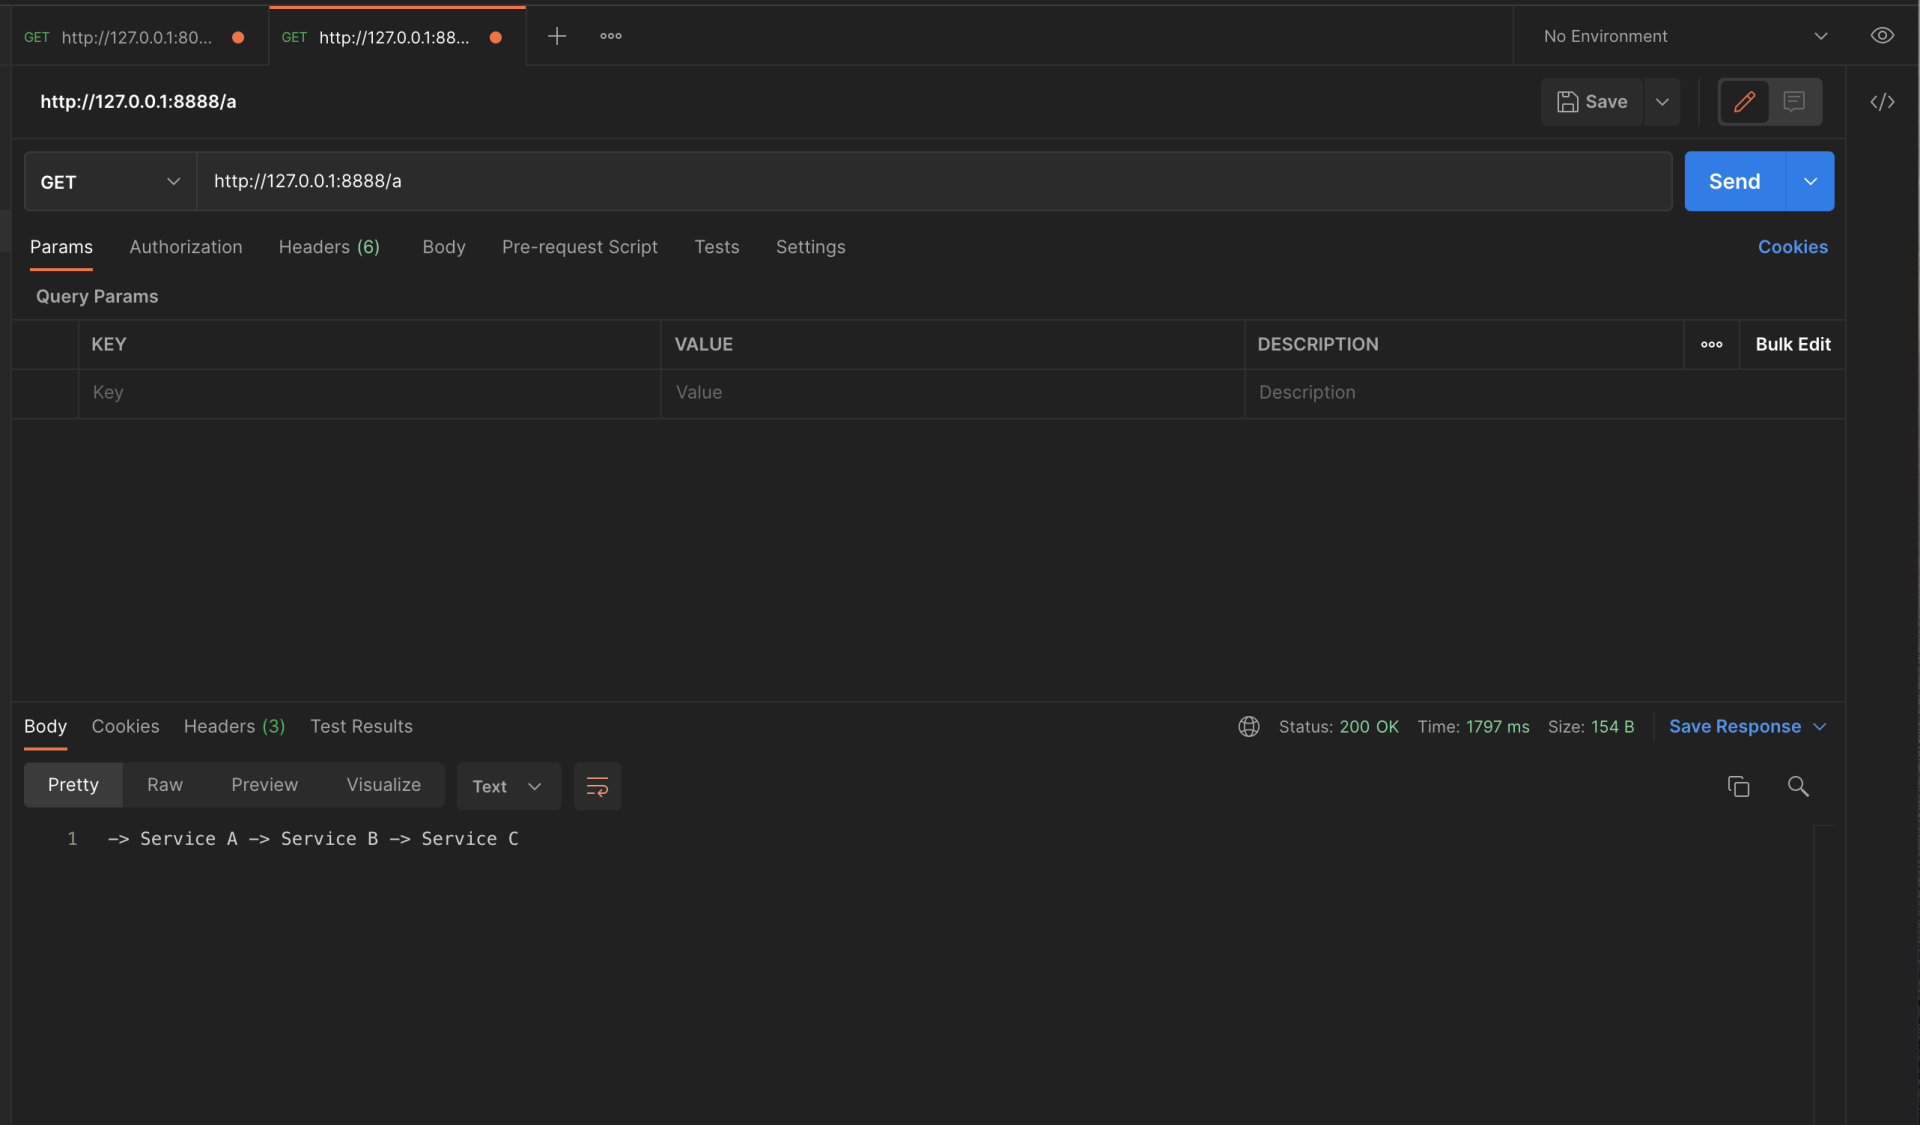
最后启动所有应用,我们使用 Postman 测试一下接口,执行一次请求操作,尝试追踪该链路。
|
|
|
|
|
|
|
|
|
|
|
|
|
|
|
|
|
|
|
|
|
|
|
|
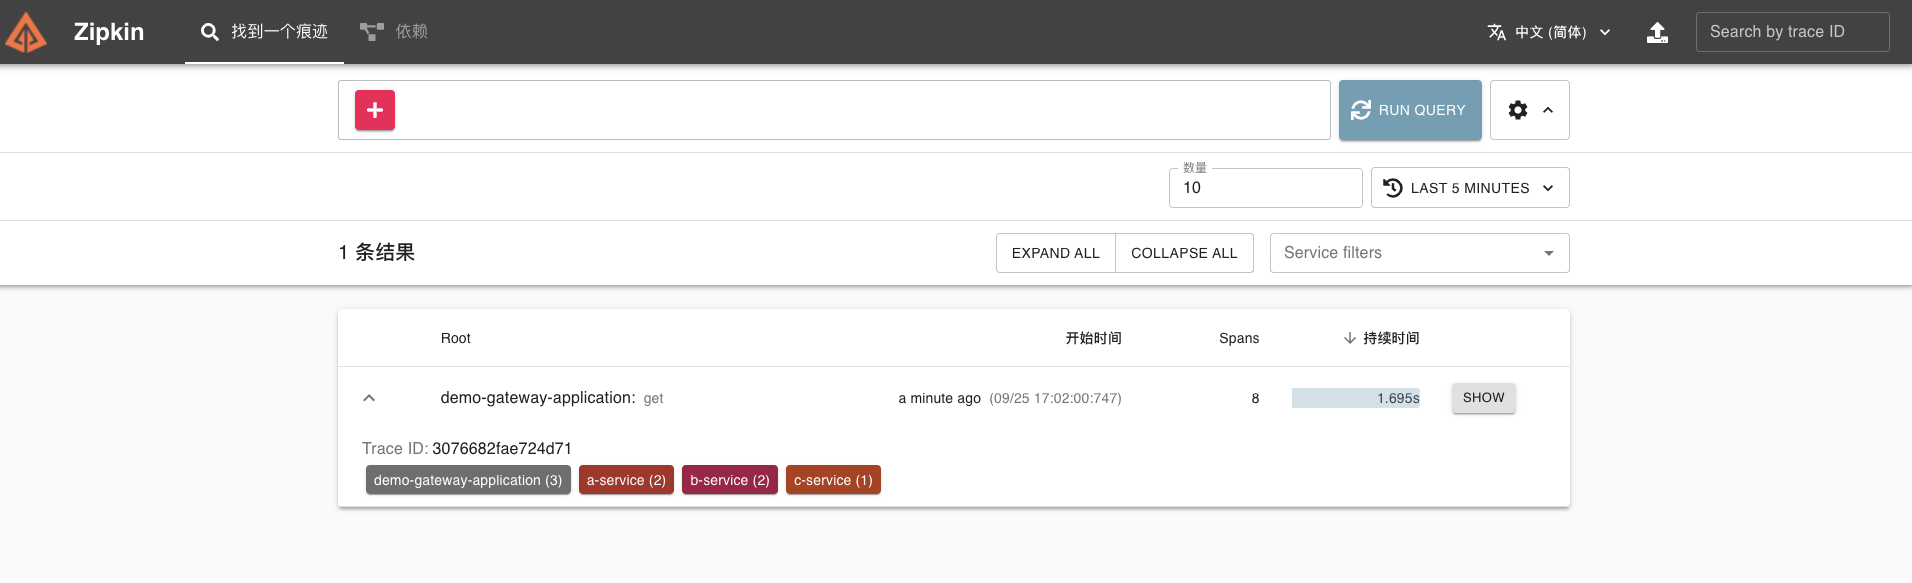
在 Zipkin 可视化 UI 就可以看到刚才我们调用接口的链路数据了。
|
|
|
|
|
|
|
|
|
|
|
|
|
|
|
|
|
|
|
|
|
|
|
|
这条链路经过 gateway、a-service、b-service、c-service 四个服务。
|
|
|
|
|
|
|
|
|
|
|
|
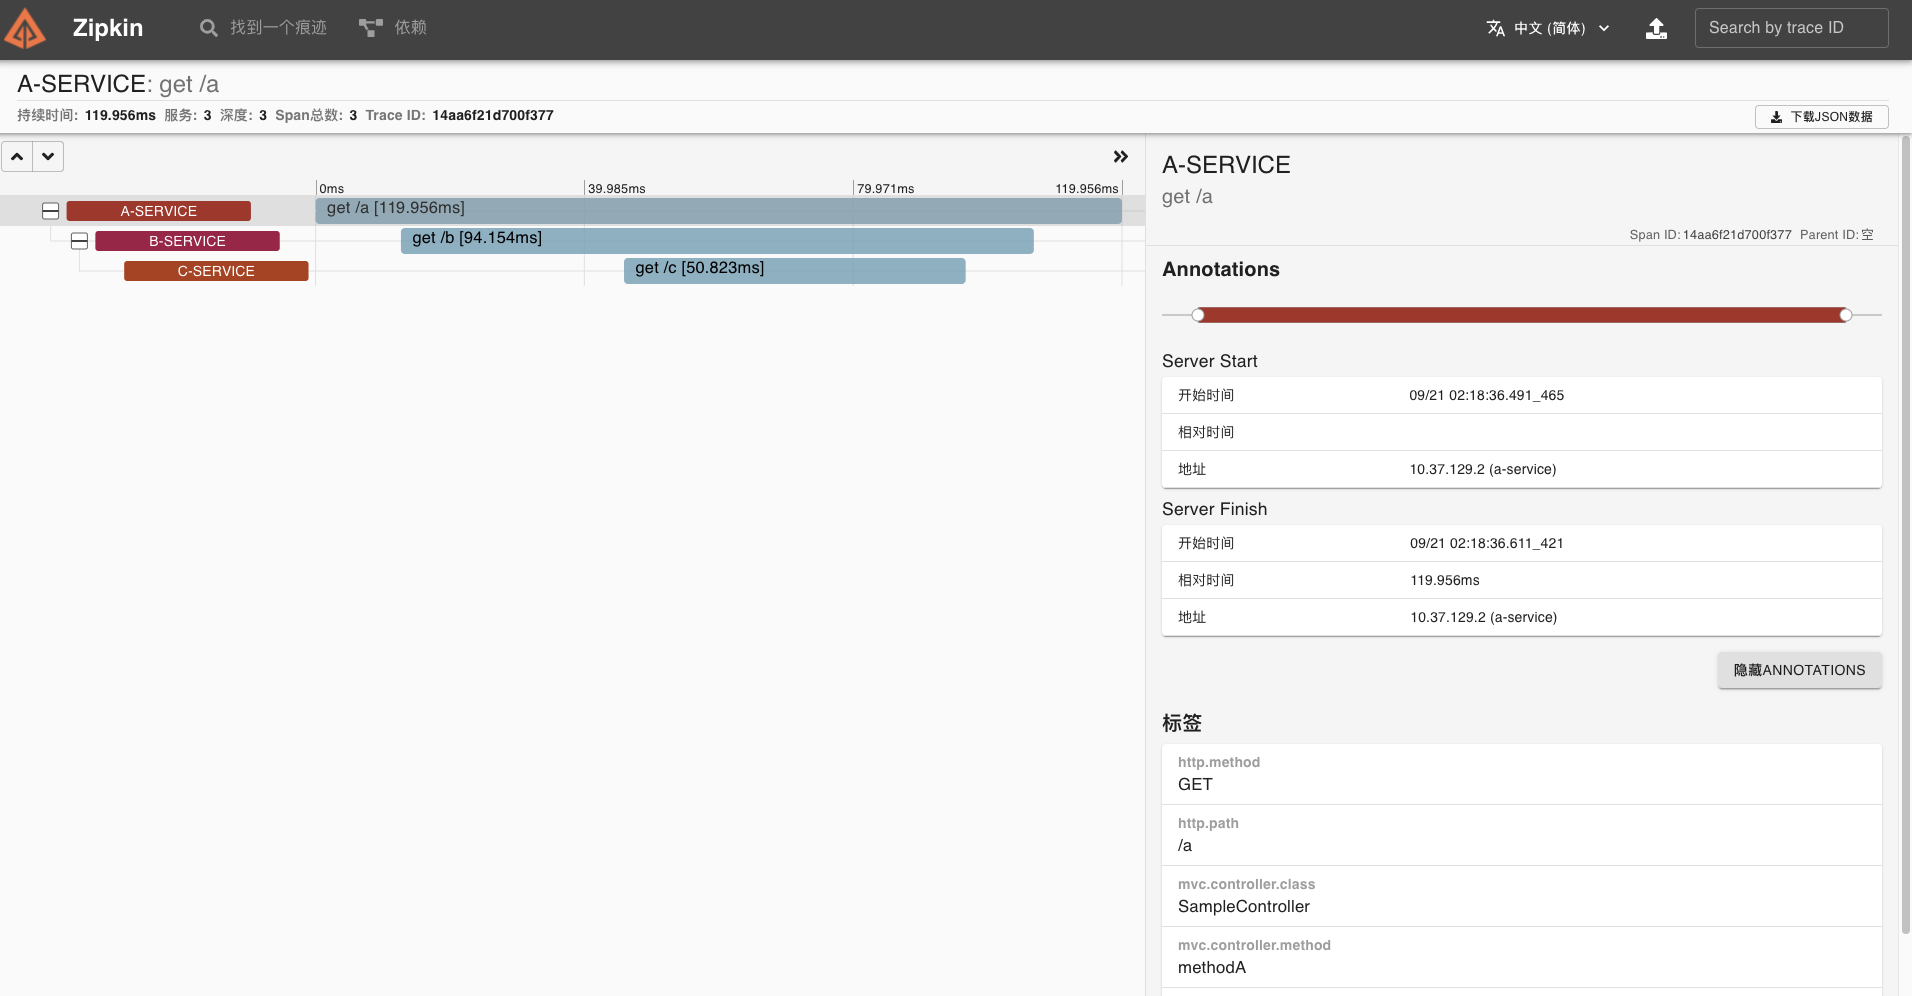
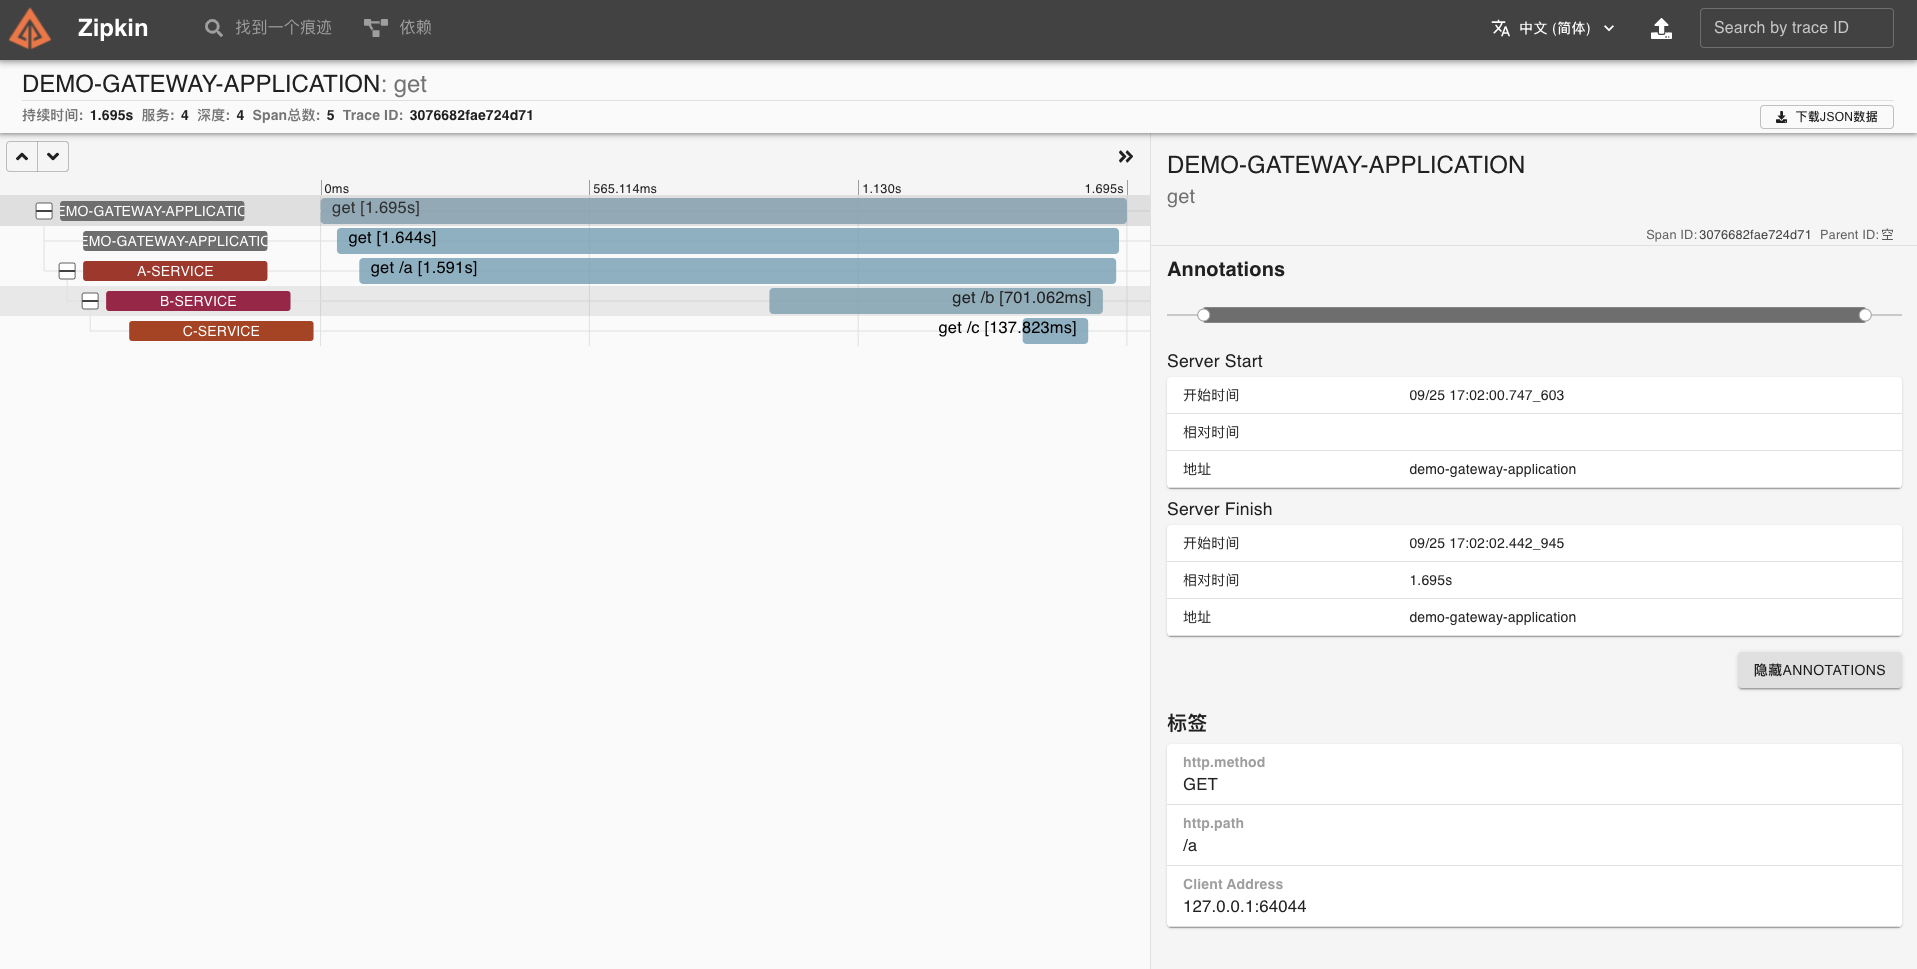
我们点开该链路,可以看到一个 Trace 明细。
|
|
|
|
|
|
|
|
|
|
|
|
|
|
|
|
|
|
|
|
|
|
|
|
### MySQL
|
|
|
|
|
|
|
|
|
|
|
|
这里需要实现一个简单的 MySQL 查询,接下来我会使用 MySQL8 驱动进行数据库的操作,这也是我们项目目前采用的方式。
|
|
|
|
|
|
|
|
|
|
|
|
目前 Brave 支持通过三种插件实现 MySQL 链路数据收集,它们分别是:
|
|
|
|
|
|
|
|
|
|
|
|
* [brave-instrumentation-mysql](https://github.com/openzipkin/brave/tree/master/instrumentation/mysql)
|
|
|
|
|
|
* [brave-instrumentation-mysql6](https://github.com/openzipkin/brave/blob/master/instrumentation/mysql6/)
|
|
|
|
|
|
* [brave-instrumentation-mysql8](https://github.com/openzipkin/brave/blob/master/instrumentation/mysql8/)
|
|
|
|
|
|
|
|
|
|
|
|
我简单演示一下用 Spring JDBC Template 的方式进行 MySQL 操作的步骤。
|
|
|
|
|
|
|
|
|
|
|
|
第一步,创建 pom.xml 文件,引入相关依赖。
|
|
|
|
|
|
|
|
|
|
|
|
```xml
|
|
|
|
|
|
<dependencies>
|
|
|
|
|
|
<!-- 引入 SpringMVC 相关依赖,并实现对其的自动配置 -->
|
|
|
|
|
|
<dependency>
|
|
|
|
|
|
<groupId>org.springframework.boot</groupId>
|
|
|
|
|
|
<artifactId>spring-boot-starter-web</artifactId>
|
|
|
|
|
|
</dependency>
|
|
|
|
|
|
<!-- 实现对数据库连接池的自动化配置 -->
|
|
|
|
|
|
<dependency>
|
|
|
|
|
|
<groupId>org.springframework.boot</groupId>
|
|
|
|
|
|
<artifactId>spring-boot-starter-jdbc</artifactId>
|
|
|
|
|
|
</dependency>
|
|
|
|
|
|
<!--Mysql 数据库驱动-->
|
|
|
|
|
|
<dependency>
|
|
|
|
|
|
<groupId>mysql</groupId>
|
|
|
|
|
|
<artifactId>mysql-connector-java</artifactId>
|
|
|
|
|
|
<version>8.0.15</version>
|
|
|
|
|
|
</dependency>
|
|
|
|
|
|
<!-- 引入 Zipkin 依赖-->
|
|
|
|
|
|
<dependency>
|
|
|
|
|
|
<groupId>org.springframework.cloud</groupId>
|
|
|
|
|
|
<artifactId>spring-cloud-starter-zipkin</artifactId>
|
|
|
|
|
|
</dependency>
|
|
|
|
|
|
<!--添加 Sleuth 依赖 -->
|
|
|
|
|
|
<dependency>
|
|
|
|
|
|
<groupId>org.springframework.cloud</groupId>
|
|
|
|
|
|
<artifactId>spring-cloud-starter-sleuth</artifactId>
|
|
|
|
|
|
</dependency>
|
|
|
|
|
|
<!-- Brave 对 MySQL8 的支持 -->
|
|
|
|
|
|
<dependency>
|
|
|
|
|
|
<groupId>io.zipkin.brave</groupId>
|
|
|
|
|
|
<artifactId>brave-instrumentation-mysql8</artifactId>
|
|
|
|
|
|
</dependency>
|
|
|
|
|
|
</dependencies>
|
|
|
|
|
|
|
|
|
|
|
|
```
|
|
|
|
|
|
|
|
|
|
|
|
这里引入 brave-instrumentation-mysql8 依赖,实现对 MySQL 的链路追踪。
|
|
|
|
|
|
|
|
|
|
|
|
第二步,在 application.yml 中,添加数据库相关配置。
|
|
|
|
|
|
|
|
|
|
|
|
```yaml
|
|
|
|
|
|
spring:
|
|
|
|
|
|
application:
|
|
|
|
|
|
name: demo-service # 服务名
|
|
|
|
|
|
sleuth:
|
|
|
|
|
|
sampler: #采样器
|
|
|
|
|
|
probability: 1.0 #采样率,采样率是采集 Trace 的比率,默认 0.1
|
|
|
|
|
|
rate: 10000 #每秒数据采集量,最多 n 条/秒 Trace
|
|
|
|
|
|
web: # Web 组件的配置项,例如说 SpringMVC
|
|
|
|
|
|
enabled: true
|
|
|
|
|
|
zipkin: #设置 zipkin 服务端地址
|
|
|
|
|
|
base-url: http://127.0.0.1:9411
|
|
|
|
|
|
|
|
|
|
|
|
# datasource 数据源配置内容
|
|
|
|
|
|
datasource:
|
|
|
|
|
|
url: jdbc:mysql://127.0.0.1:3306/test?useSSL=false&useUnicode=true&characterEncoding=UTF-8&queryInterceptors=brave.mysql8.TracingQueryInterceptor&exceptionInterceptors=brave.mysql8.TracingExceptionInterceptor&zipkinServiceName=mysql-demo
|
|
|
|
|
|
driver-class-name: com.mysql.jdbc.Driver
|
|
|
|
|
|
username: root
|
|
|
|
|
|
password: root
|
|
|
|
|
|
|
|
|
|
|
|
logging:
|
|
|
|
|
|
level:
|
|
|
|
|
|
root: debug #为演示需要,开启 debug 级别日志
|
|
|
|
|
|
|
|
|
|
|
|
```
|
|
|
|
|
|
|
|
|
|
|
|
在这里,Brave 通过实现类 [TracingQueryInterceptor](https://github.com/openzipkin/brave/blob/master/instrumentation/mysql8/src/main/java/brave/mysql8/TracingQueryInterceptor.java) 拦截 SQL 请求,进行 MySQL 的链路追踪。切记,在 spring.datasource.url 配置项上的 queryInterceptors、exceptionInterceptors 和 zipkinServiceName 属性上,一定要分别设置拦截器和该 MySQL 在 Zipkin 中展示的服务名。
|
|
|
|
|
|
|
|
|
|
|
|
第三步,在 MySQL 数据库中,创建用户表并插入数据。
|
|
|
|
|
|
|
|
|
|
|
|
```sql
|
|
|
|
|
|
CREATE TABLE `t_user` (
|
|
|
|
|
|
`id` int(8) NOT NULL AUTO_INCREMENT COMMENT '主键自增',
|
|
|
|
|
|
`username` varchar(50) NOT NULL COMMENT '用户名',
|
|
|
|
|
|
`password` varchar(50) NOT NULL COMMENT '密码',
|
|
|
|
|
|
PRIMARY KEY (`id`)
|
|
|
|
|
|
) ENGINE=InnoDB AUTO_INCREMENT=1 DEFAULT CHARSET=utf8 COMMENT='用户表';
|
|
|
|
|
|
|
|
|
|
|
|
INSERT INTO `t_user`(`id`, `username`, `password`) VALUES (1, '7d', '123456');
|
|
|
|
|
|
|
|
|
|
|
|
|
|
|
|
|
|
```
|
|
|
|
|
|
|
|
|
|
|
|
第四步,创建 DemoController 类,提供示例 API 接口。
|
|
|
|
|
|
|
|
|
|
|
|
```java
|
|
|
|
|
|
package com.dunshan.mysql8demo.controller;
|
|
|
|
|
|
import org.springframework.beans.factory.annotation.Autowired;
|
|
|
|
|
|
import org.springframework.jdbc.core.BeanPropertyRowMapper;
|
|
|
|
|
|
import org.springframework.jdbc.core.JdbcTemplate;
|
|
|
|
|
|
import org.springframework.web.bind.annotation.GetMapping;
|
|
|
|
|
|
import org.springframework.web.bind.annotation.RequestMapping;
|
|
|
|
|
|
import org.springframework.web.bind.annotation.RequestParam;
|
|
|
|
|
|
import org.springframework.web.bind.annotation.RestController;
|
|
|
|
|
|
|
|
|
|
|
|
@RestController
|
|
|
|
|
|
@RequestMapping("/7d")
|
|
|
|
|
|
public class DemoController {
|
|
|
|
|
|
@Autowired
|
|
|
|
|
|
private JdbcTemplate template;
|
|
|
|
|
|
@GetMapping("/get")
|
|
|
|
|
|
public String get(@RequestParam("id") Integer id) {
|
|
|
|
|
|
this.selectById(1);
|
|
|
|
|
|
return "success";
|
|
|
|
|
|
}
|
|
|
|
|
|
public Object selectById(Integer id) {
|
|
|
|
|
|
return template.queryForObject("SELECT id, username, password FROM t_user WHERE id = ?",
|
|
|
|
|
|
new BeanPropertyRowMapper<>(Object.class), // 结果转换成对应的对象。
|
|
|
|
|
|
id);
|
|
|
|
|
|
}
|
|
|
|
|
|
}
|
|
|
|
|
|
|
|
|
|
|
|
```
|
|
|
|
|
|
|
|
|
|
|
|
第五步,创建 DemoServiceApplication 启动类。
|
|
|
|
|
|
|
|
|
|
|
|
```java
|
|
|
|
|
|
package com.dunshan.mysql8demo;
|
|
|
|
|
|
import org.springframework.boot.SpringApplication;
|
|
|
|
|
|
import org.springframework.boot.autoconfigure.SpringBootApplication;
|
|
|
|
|
|
|
|
|
|
|
|
@SpringBootApplication
|
|
|
|
|
|
public class DemoServiceApplication {
|
|
|
|
|
|
public static void main(String[] args) {
|
|
|
|
|
|
SpringApplication.run(DemoServiceApplication.class, args);
|
|
|
|
|
|
}
|
|
|
|
|
|
}
|
|
|
|
|
|
|
|
|
|
|
|
```
|
|
|
|
|
|
|
|
|
|
|
|
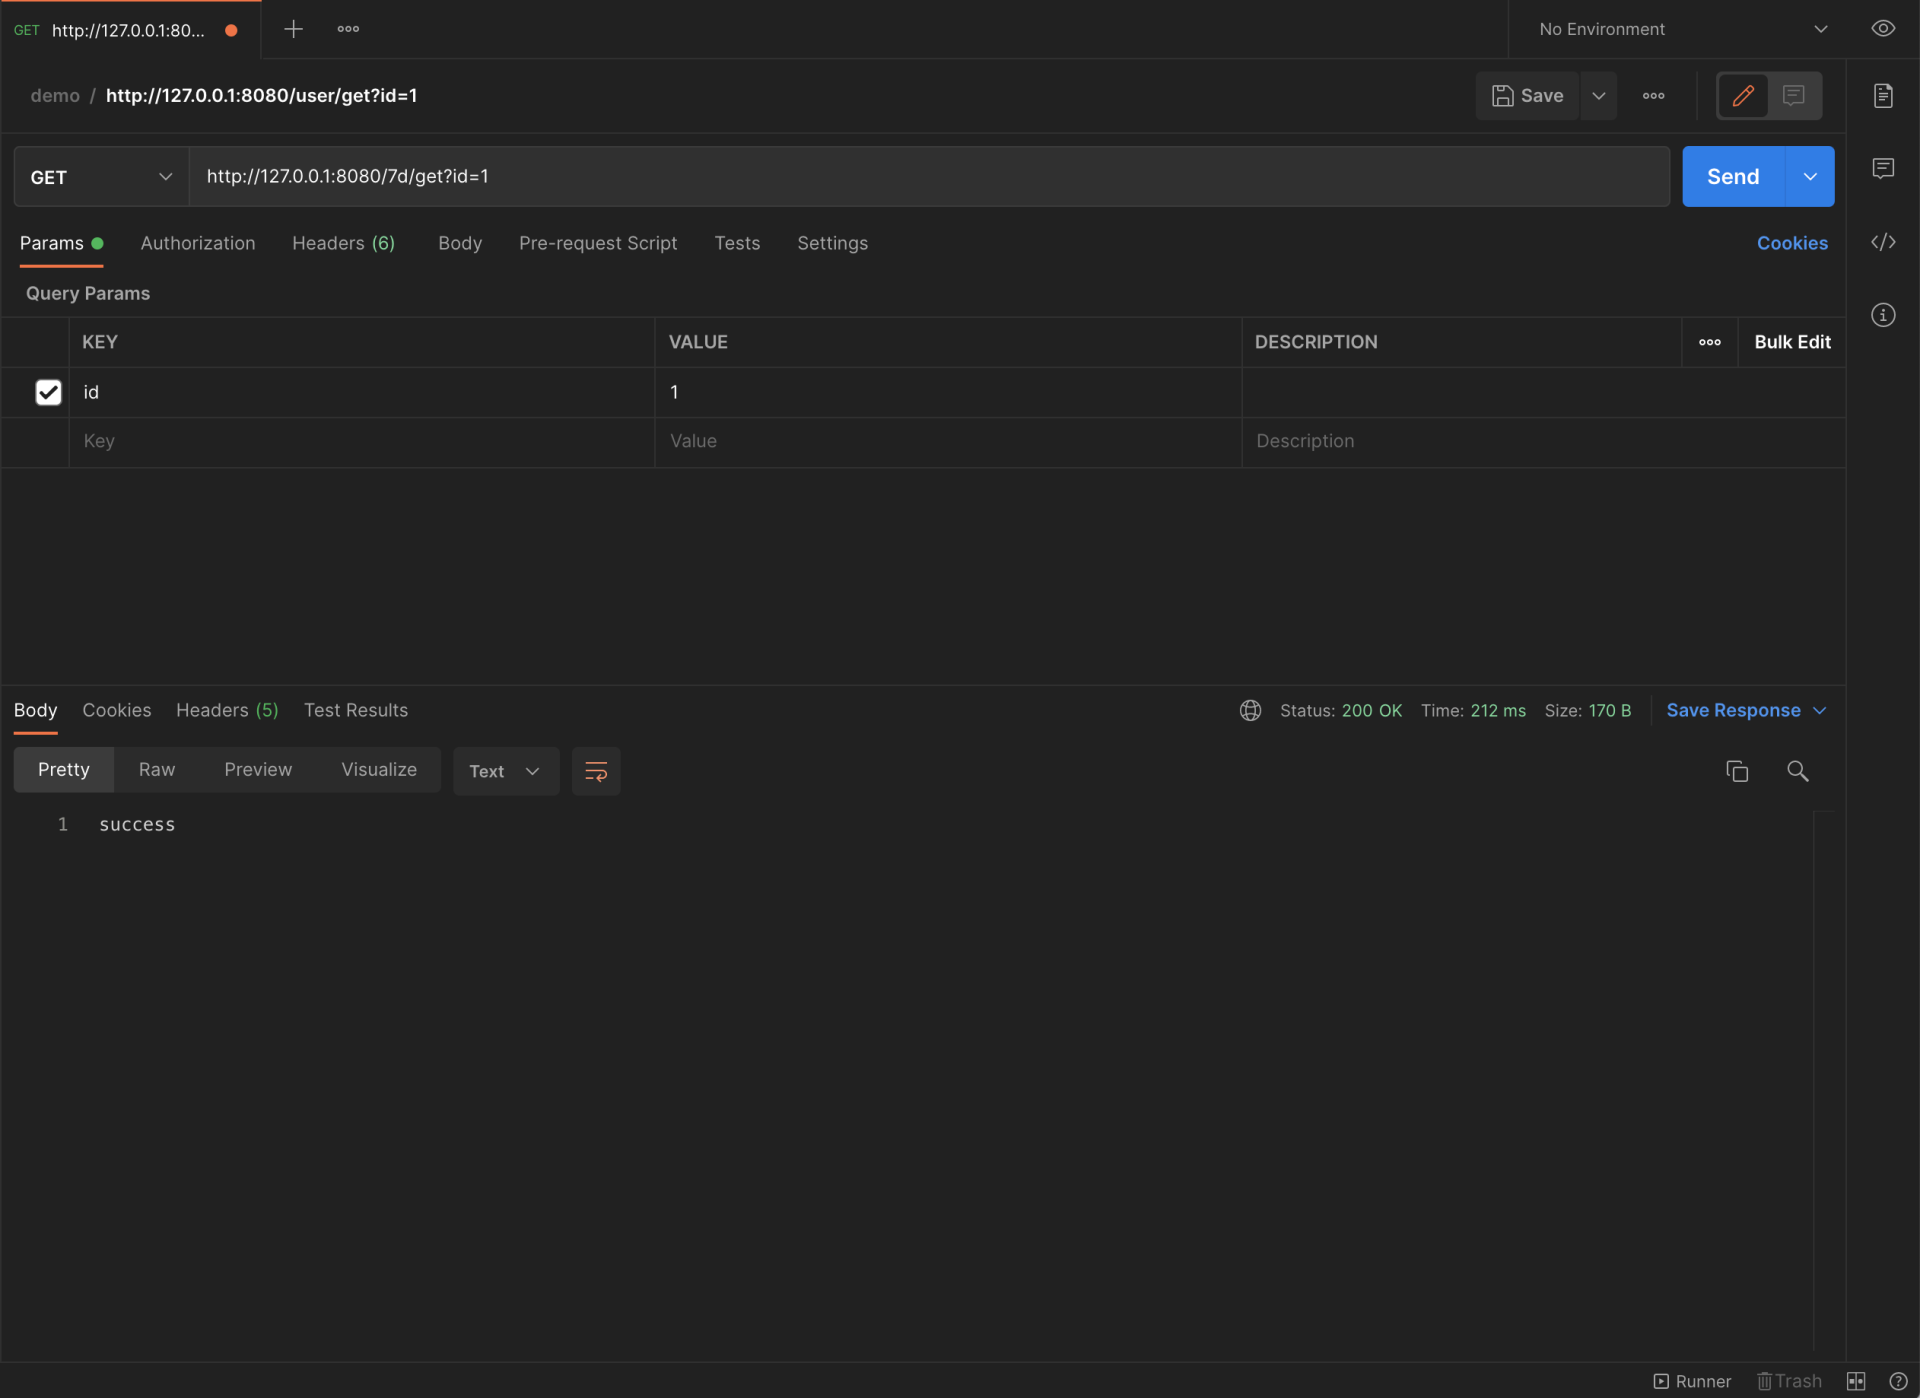
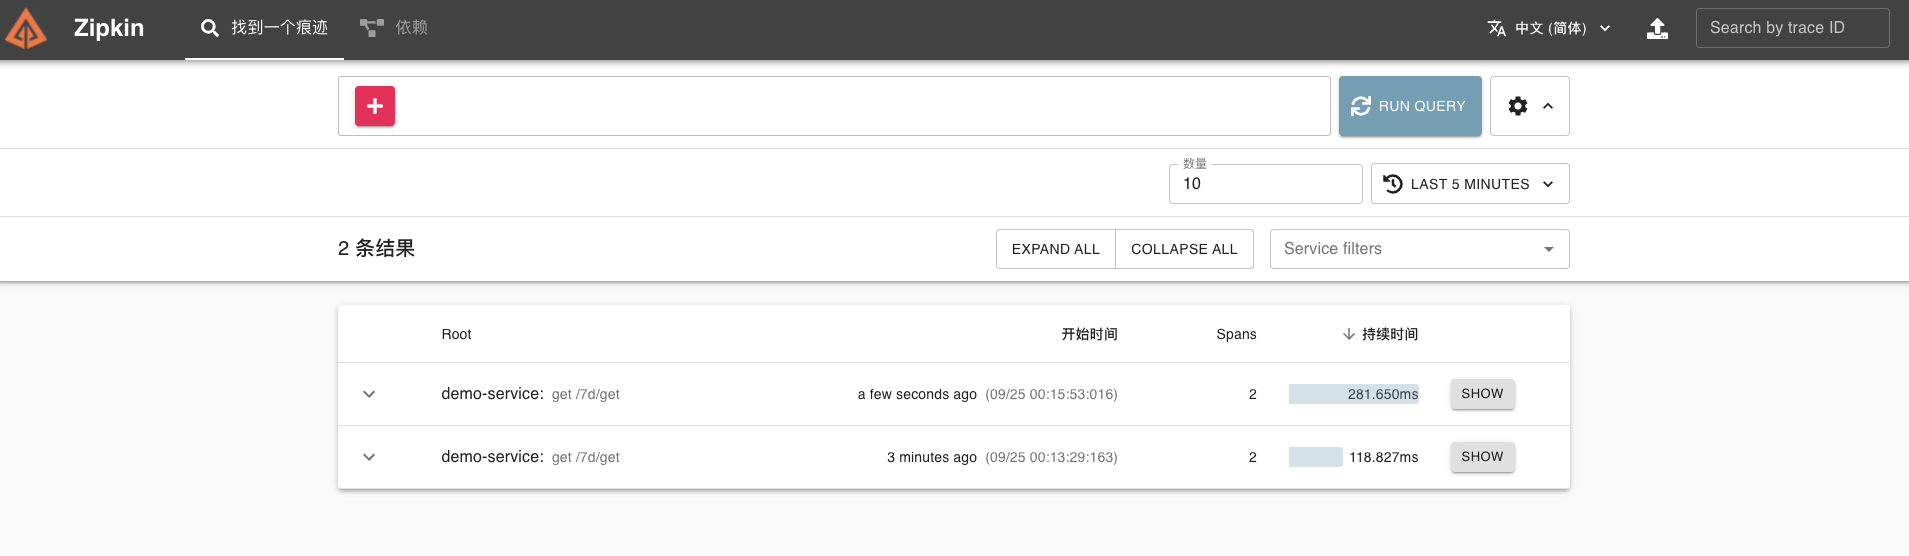
这样在 /7d/get 接口会执行一次 MySQL 的查询操作。
|
|
|
|
|
|
最后启动应用,我们使用 Postman 测试一下接口,尝试追踪该链路。
|
|
|
|
|
|
|
|
|
|
|
|
|
|
|
|
|
|
|
|
|
|
|
|
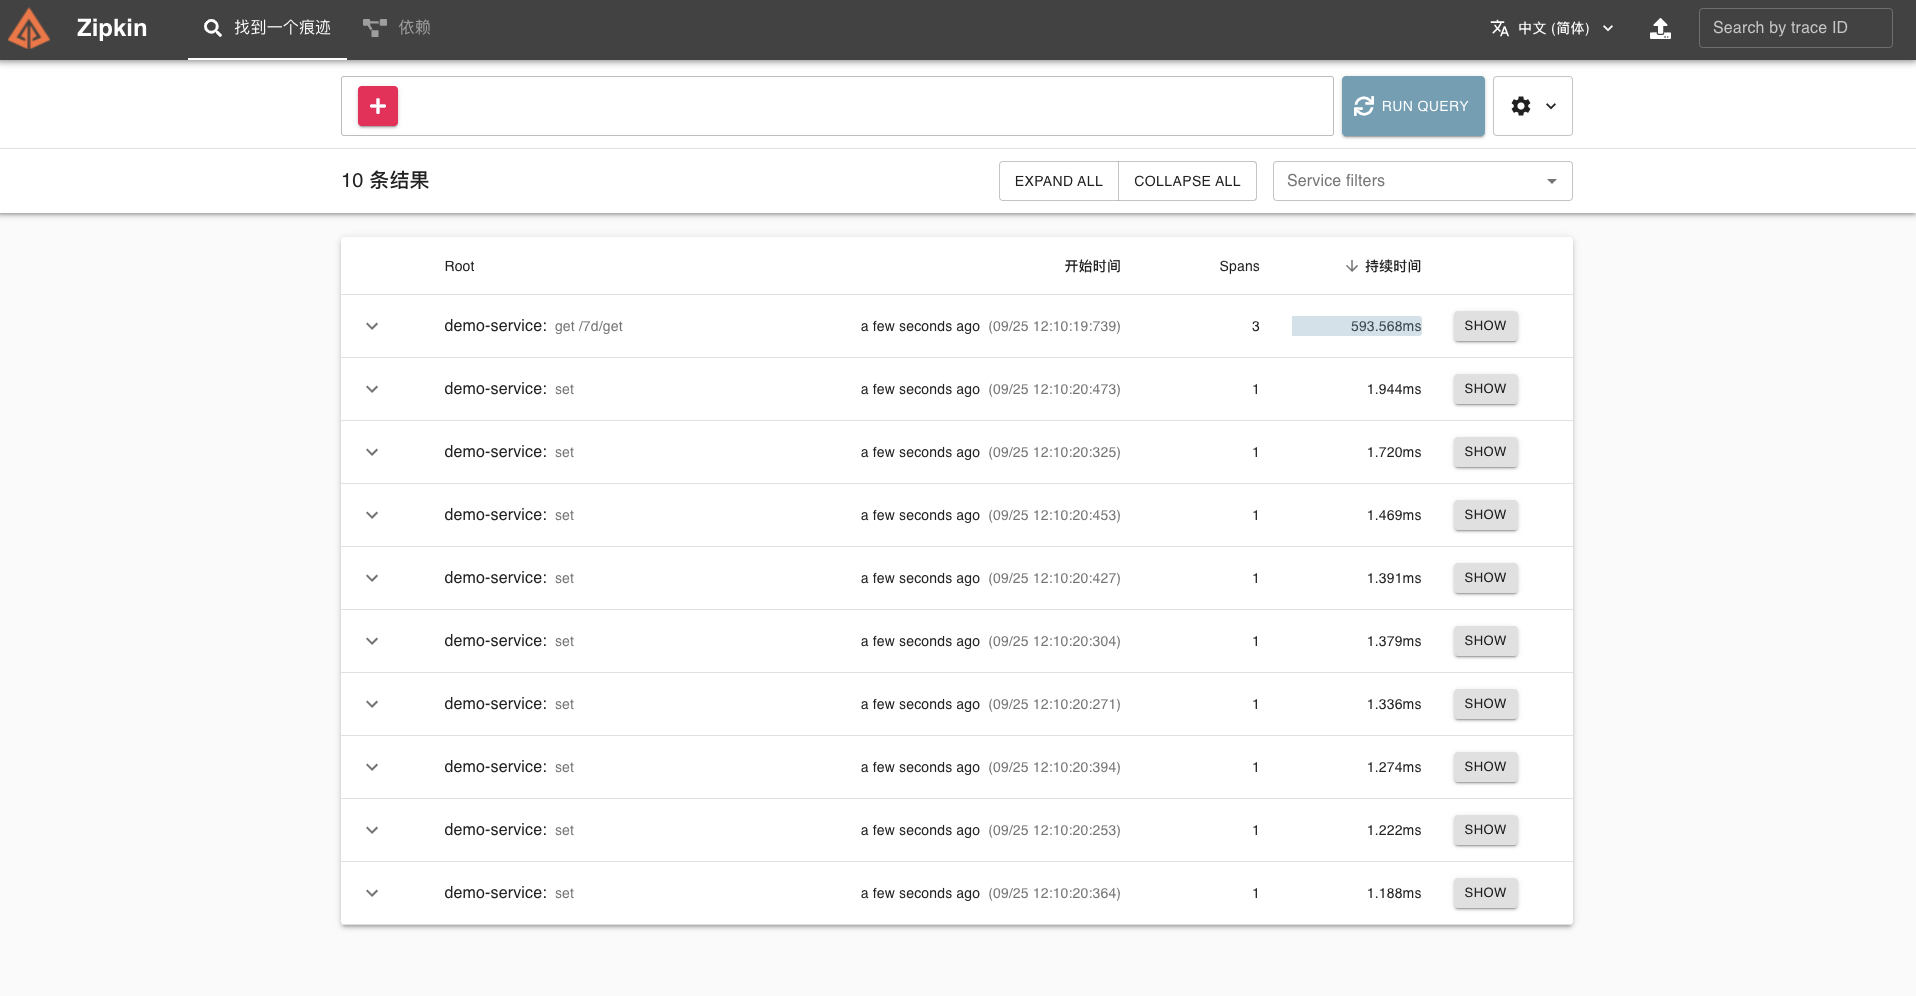
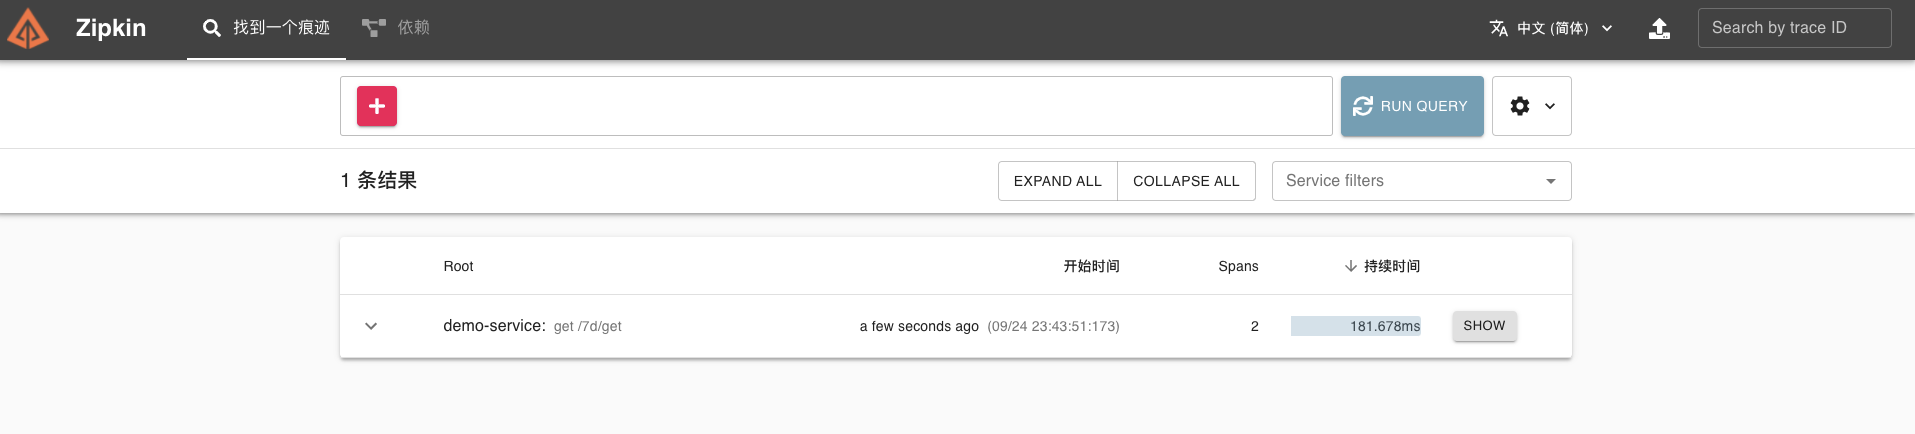
同样在 Zipkin 可视化 UI 也可以看到刚才调用接口的链路数据。
|
|
|
|
|
|
|
|
|
|
|
|
|
|
|
|
|
|
|
|
|
|
|
|
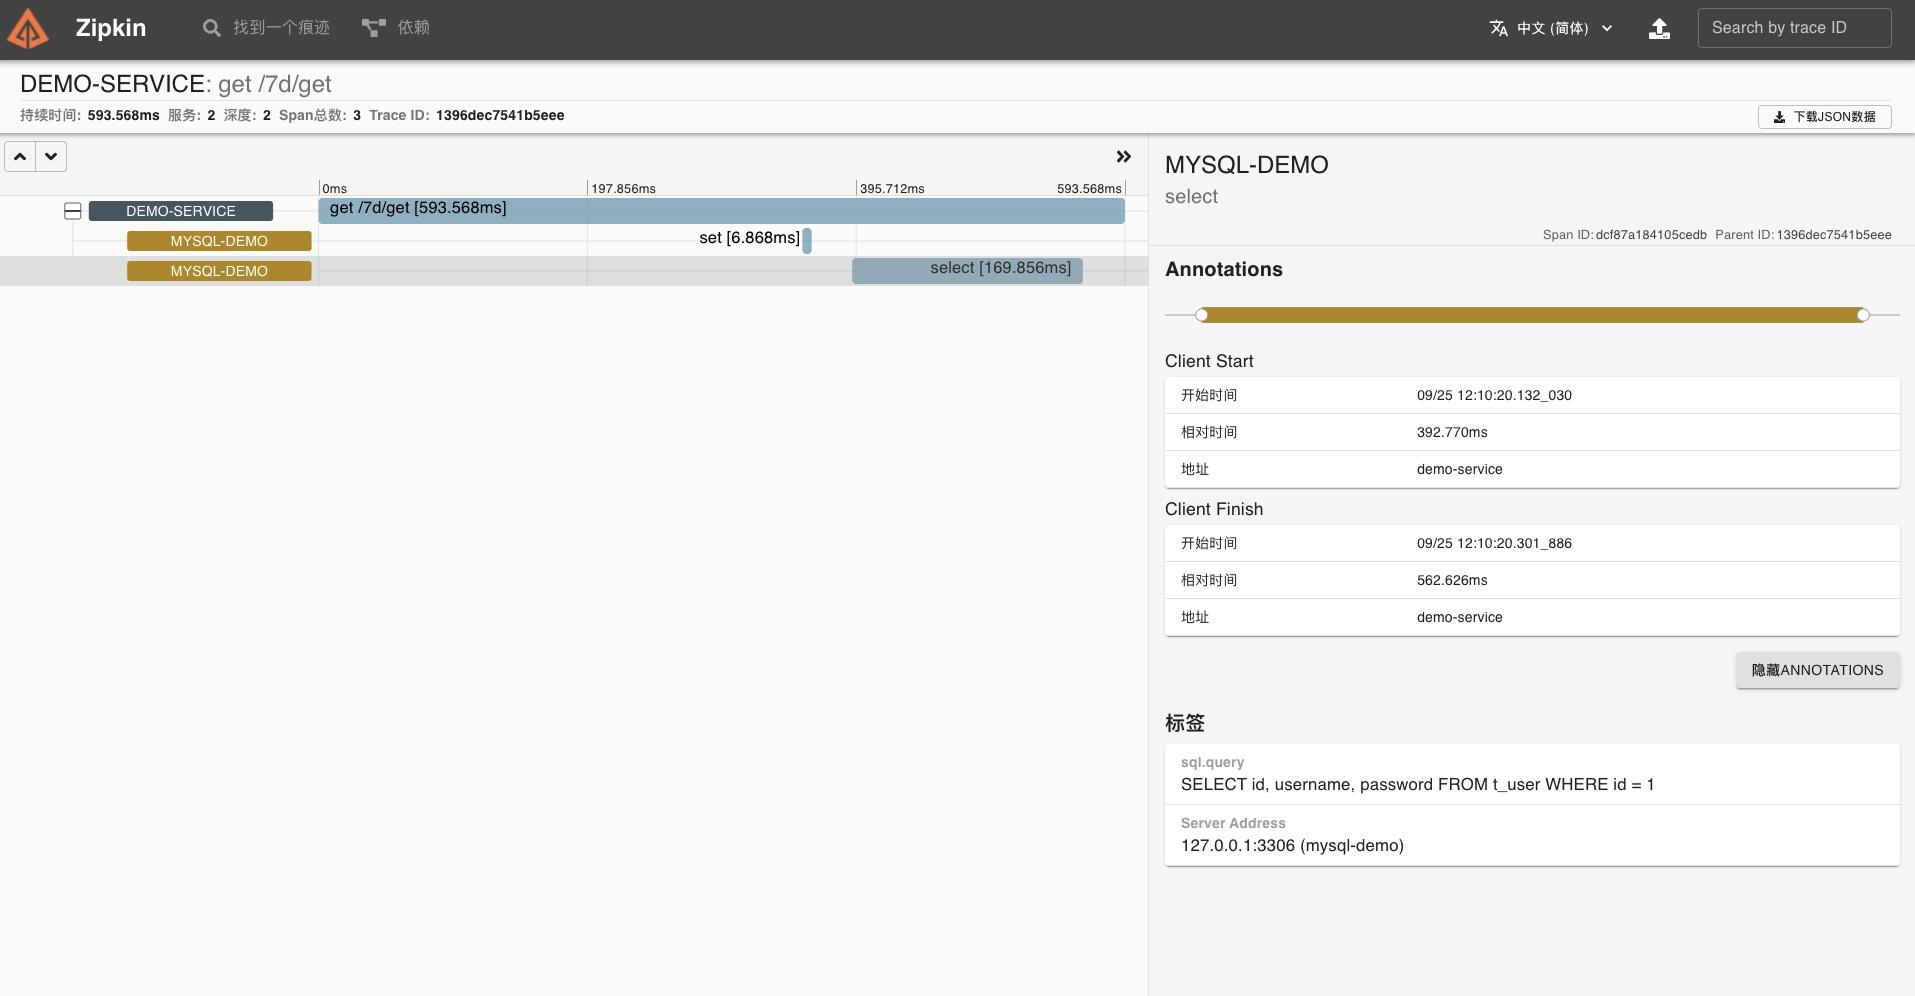
点开这个链路,可以看到一个 Trace 明细。
|
|
|
|
|
|
|
|
|
|
|
|
|
|
|
|
|
|
|
|
|
|
|
|
到这里,我们的 MySQL 组件链路追踪就成功了。
|
|
|
|
|
|
|
|
|
|
|
|
### Redis
|
|
|
|
|
|
|
|
|
|
|
|
这一部分需要实现简单的 Redis 操作,接下来我们使用 Spring Data Redis + Jedis 进行 Redis 的操作(项目部分服务使用的方式)。目前 Brave 暂未支持 Jedis 客户端的方式,所以我们只能考虑其它的办法。
|
|
|
|
|
|
|
|
|
|
|
|
在 [opentracing-contrib](https://github.com/opentracing) 项目中,有一个 [java-redis-client](https://github.com/opentracing-contrib/java-redis-client) 子项目,提供了 OpenTracing 针对 Jedis、Lettuce 等客户端的链路追踪功能。这样,我们搭配上 [brave-opentracing](https://github.com/openzipkin-contrib/brave-opentracing) 项目,可以使用 OpenTracing API 收集的链路数据,发送给 Zipkin。
|
|
|
|
|
|
|
|
|
|
|
|
而 Lettuce 基于 Brave 实现了 [BraveTracing](https://github.com/lettuce-io/lettuce-core/blob/main/src/main/java/io/lettuce/core/tracing/BraveTracing.java) ,从而可以实现对 Redis 操作的链路追踪。并且,Spring Cloud Sleuth 的 [instrument/redis](https://github.com/spring-cloud/spring-cloud-sleuth/tree/main/spring-cloud-sleuth-autoconfigure/src/main/java/org/springframework/cloud/sleuth/autoconfig/instrument/redis) 模块对它实现了自动配置。如果项目中是使用 Lettuce 作为 Redis 客户端的话,可以考虑采用这种方式。
|
|
|
|
|
|
|
|
|
|
|
|
我们还是来看下具体的操作步骤。
|
|
|
|
|
|
|
|
|
|
|
|
第一步,创建 pom.xml 文件,引入相关依赖。
|
|
|
|
|
|
|
|
|
|
|
|
```xml
|
|
|
|
|
|
<dependencies>
|
|
|
|
|
|
<!-- 引入 SpringMVC 相关依赖,并实现对其的自动配置 -->
|
|
|
|
|
|
<dependency>
|
|
|
|
|
|
<groupId>org.springframework.boot</groupId>
|
|
|
|
|
|
<artifactId>spring-boot-starter-web</artifactId>
|
|
|
|
|
|
</dependency>
|
|
|
|
|
|
<!-- 实现对 Spring Data Redis 的自动化配置 -->
|
|
|
|
|
|
<dependency>
|
|
|
|
|
|
<groupId>org.springframework.boot</groupId>
|
|
|
|
|
|
<artifactId>spring-boot-starter-data-redis</artifactId>
|
|
|
|
|
|
<exclusions>
|
|
|
|
|
|
<!-- 去掉对 Lettuce 的依赖,因为 Spring Boot 优先使用 Lettuce 作为 Redis 客户端 -->
|
|
|
|
|
|
<exclusion>
|
|
|
|
|
|
<groupId>io.lettuce</groupId>
|
|
|
|
|
|
<artifactId>lettuce-core</artifactId>
|
|
|
|
|
|
</exclusion>
|
|
|
|
|
|
</exclusions>
|
|
|
|
|
|
</dependency>
|
|
|
|
|
|
<!-- 引入 Jedis 的依赖 -->
|
|
|
|
|
|
<dependency>
|
|
|
|
|
|
<groupId>redis.clients</groupId>
|
|
|
|
|
|
<artifactId>jedis</artifactId>
|
|
|
|
|
|
</dependency>
|
|
|
|
|
|
<!-- 引入 Zipkin 相关依赖-->
|
|
|
|
|
|
<dependency>
|
|
|
|
|
|
<groupId>org.springframework.cloud</groupId>
|
|
|
|
|
|
<artifactId>spring-cloud-starter-zipkin</artifactId>
|
|
|
|
|
|
</dependency>
|
|
|
|
|
|
<!--引入 Sleuth 相关依赖 -->
|
|
|
|
|
|
<dependency>
|
|
|
|
|
|
<groupId>org.springframework.cloud</groupId>
|
|
|
|
|
|
<artifactId>spring-cloud-starter-sleuth</artifactId>
|
|
|
|
|
|
</dependency>
|
|
|
|
|
|
<!-- Brave 对 Opentracing 的实现 -->
|
|
|
|
|
|
<dependency>
|
|
|
|
|
|
<groupId>io.opentracing.brave</groupId>
|
|
|
|
|
|
<artifactId>brave-opentracing</artifactId>
|
|
|
|
|
|
<version>0.35.0</version>
|
|
|
|
|
|
</dependency>
|
|
|
|
|
|
<!-- Opentracing 对 Redis 的支持 -->
|
|
|
|
|
|
<dependency>
|
|
|
|
|
|
<groupId>io.opentracing.contrib</groupId>
|
|
|
|
|
|
<artifactId>opentracing-redis-jedis3</artifactId>
|
|
|
|
|
|
<version>0.1.16</version>
|
|
|
|
|
|
</dependency>
|
|
|
|
|
|
<dependency>
|
|
|
|
|
|
<groupId>io.opentracing.contrib</groupId>
|
|
|
|
|
|
<artifactId>opentracing-redis-spring-data</artifactId>
|
|
|
|
|
|
<version>0.1.16</version>
|
|
|
|
|
|
</dependency>
|
|
|
|
|
|
</dependencies>
|
|
|
|
|
|
|
|
|
|
|
|
```
|
|
|
|
|
|
|
|
|
|
|
|
这里引入 [brave-opentracing](https://mvnrepository.com/artifact/io.opentracing.brave/brave-opentracing) 依赖,也就是 Brave 对 Opentracing 的实现。
|
|
|
|
|
|
|
|
|
|
|
|
注意,Opentracing 和 JDBC 一样是一个通用标准,因此需要有 Brave 对 Opentracing 做具体实现,从而将链路数据写入到 Zipkin 中。就好比 JDBC 对 MySQL Driver 实现,将数据写入到 MySQL 数据库中一样。
|
|
|
|
|
|
|
|
|
|
|
|
同时,我们要引入 [opentracing-redis-spring-data](https://mvnrepository.com/artifact/io.opentracing.contrib/opentracing-redis-spring-data) 和 [opentracing-redis-jedis3](https://mvnrepository.com/artifact/io.opentracing.contrib/opentracing-redis-jedis3) 依赖,实现对 Jedis 操作 Redis 的链路追踪。
|
|
|
|
|
|
|
|
|
|
|
|
第二步,在 application.yml 中,添加redis相关配置。
|
|
|
|
|
|
|
|
|
|
|
|
```yaml
|
|
|
|
|
|
spring:
|
|
|
|
|
|
application:
|
|
|
|
|
|
name: demo-service # 服务名
|
|
|
|
|
|
sleuth:
|
|
|
|
|
|
sampler: #采样器
|
|
|
|
|
|
probability: 1.0 #采样率,采样率是采集 Trace 的比率,默认 0.1
|
|
|
|
|
|
rate: 10000 #每秒数据采集量,最多 n 条/秒 Trace
|
|
|
|
|
|
zipkin: #设置 zipkin 服务端地址
|
|
|
|
|
|
base-url: http://127.0.0.1:9411
|
|
|
|
|
|
|
|
|
|
|
|
# 对应 RedisProperties 类
|
|
|
|
|
|
redis:
|
|
|
|
|
|
host: 127.0.0.1
|
|
|
|
|
|
port: 6379
|
|
|
|
|
|
password: # Redis redis密码,默认为空。
|
|
|
|
|
|
database: 0 # Redis redis中的数据库号,默认为 0。
|
|
|
|
|
|
timeout: 6000 # Redis 连接超时时间,单位:毫秒。
|
|
|
|
|
|
# 对应 RedisProperties.Jedis 内部类
|
|
|
|
|
|
jedis:
|
|
|
|
|
|
pool:
|
|
|
|
|
|
max-active: 8 # 连接池最大连接数,默认为 8。使用负数表示没有限制。
|
|
|
|
|
|
max-idle: 8 # 默认连接数最小空闲的连接数,默认为 8。使用负数表示没有限制。
|
|
|
|
|
|
min-idle: 0 # 默认连接池最小空闲的连接数,默认为 0。允许设置 0 和 正数。
|
|
|
|
|
|
max-wait: -1 # 连接池最大阻塞等待时间,单位:毫秒。默认为 -1,表示不限制。
|
|
|
|
|
|
logging:
|
|
|
|
|
|
level:
|
|
|
|
|
|
root: debug #为演示需要,开启 debug 级别日志
|
|
|
|
|
|
|
|
|
|
|
|
```
|
|
|
|
|
|
|
|
|
|
|
|
第三步,创建 SleuthConfiguration 配置类,创建一个 [TracingRedisConnectionFactory](https://github.com/opentracing-contrib/java-redis-client/blob/master/opentracing-redis-spring-data2/src/main/java/io/opentracing/contrib/redis/spring/data2/connection/TracingRedisConnectionFactory.java) Bean 对象。这样,我们就能拦截到 Redis 操作,进行相应的链路跟踪了。
|
|
|
|
|
|
|
|
|
|
|
|
```java
|
|
|
|
|
|
package com.dunsan.redisdemo.config;
|
|
|
|
|
|
|
|
|
|
|
|
import io.opentracing.Tracer;
|
|
|
|
|
|
import io.opentracing.contrib.redis.common.TracingConfiguration;
|
|
|
|
|
|
import io.opentracing.contrib.redis.spring.data.connection.TracingRedisConnectionFactory;
|
|
|
|
|
|
import org.springframework.boot.autoconfigure.data.redis.RedisProperties;
|
|
|
|
|
|
import org.springframework.context.annotation.Bean;
|
|
|
|
|
|
import org.springframework.context.annotation.Configuration;
|
|
|
|
|
|
import org.springframework.data.redis.connection.RedisConnectionFactory;
|
|
|
|
|
|
import org.springframework.data.redis.connection.jedis.JedisConnectionFactory;
|
|
|
|
|
|
|
|
|
|
|
|
@Configuration
|
|
|
|
|
|
public class SleuthConfiguration {
|
|
|
|
|
|
|
|
|
|
|
|
@Bean
|
|
|
|
|
|
public RedisConnectionFactory redisConnectionFactory(Tracer tracer, RedisProperties redisProperties) {
|
|
|
|
|
|
// 创建 JedisConnectionFactory 对象
|
|
|
|
|
|
RedisConnectionFactory connectionFactory = new JedisConnectionFactory();
|
|
|
|
|
|
// 创建 TracingConfiguration 对象
|
|
|
|
|
|
TracingConfiguration tracingConfiguration = new TracingConfiguration.Builder(tracer)
|
|
|
|
|
|
// 设置拓展 Tag,设置 Redis 服务器地址。因为默认情况下,不会在操作 Redis 链路的 Span 上记录 Redis 服务器的地址,所以这里需要设置。
|
|
|
|
|
|
.extensionTag("Server Address", redisProperties.getHost() + ":" + redisProperties.getPort())
|
|
|
|
|
|
.build();
|
|
|
|
|
|
// 创建 TracingRedisConnectionFactory 对象
|
|
|
|
|
|
return new TracingRedisConnectionFactory(connectionFactory, tracingConfiguration);
|
|
|
|
|
|
}
|
|
|
|
|
|
|
|
|
|
|
|
}
|
|
|
|
|
|
|
|
|
|
|
|
```
|
|
|
|
|
|
|
|
|
|
|
|
第四步,创建 DemoController 类,提供示例 API 接口。
|
|
|
|
|
|
|
|
|
|
|
|
```java
|
|
|
|
|
|
package com.dunsan.redisdemo.controller;
|
|
|
|
|
|
|
|
|
|
|
|
import org.springframework.beans.factory.annotation.Autowired;
|
|
|
|
|
|
import org.springframework.data.redis.core.StringRedisTemplate;
|
|
|
|
|
|
import org.springframework.web.bind.annotation.GetMapping;
|
|
|
|
|
|
import org.springframework.web.bind.annotation.RequestMapping;
|
|
|
|
|
|
import org.springframework.web.bind.annotation.RequestParam;
|
|
|
|
|
|
import org.springframework.web.bind.annotation.RestController;
|
|
|
|
|
|
|
|
|
|
|
|
@RestController
|
|
|
|
|
|
@RequestMapping("/7d")
|
|
|
|
|
|
public class DemoController {
|
|
|
|
|
|
|
|
|
|
|
|
@Autowired
|
|
|
|
|
|
private StringRedisTemplate redisTemplate;
|
|
|
|
|
|
|
|
|
|
|
|
@GetMapping("/get")
|
|
|
|
|
|
public String get(@RequestParam("id") Integer id) {
|
|
|
|
|
|
this.get("demo");
|
|
|
|
|
|
return "success";
|
|
|
|
|
|
}
|
|
|
|
|
|
|
|
|
|
|
|
public void get(String key) {
|
|
|
|
|
|
redisTemplate.opsForValue().get(key);
|
|
|
|
|
|
}
|
|
|
|
|
|
|
|
|
|
|
|
}
|
|
|
|
|
|
|
|
|
|
|
|
```
|
|
|
|
|
|
|
|
|
|
|
|
这样在 /7d/get 接口中,就会执行一次 Redis 的查询。
|
|
|
|
|
|
|
|
|
|
|
|
第五步,创建 DemoServiceApplication 启动类。
|
|
|
|
|
|
|
|
|
|
|
|
```java
|
|
|
|
|
|
package com.dunsan.redisdemo;
|
|
|
|
|
|
|
|
|
|
|
|
import org.springframework.boot.SpringApplication;
|
|
|
|
|
|
import org.springframework.boot.autoconfigure.SpringBootApplication;
|
|
|
|
|
|
|
|
|
|
|
|
@SpringBootApplication
|
|
|
|
|
|
public class DemoServiceApplication {
|
|
|
|
|
|
|
|
|
|
|
|
public static void main(String[] args) {
|
|
|
|
|
|
SpringApplication.run(DemoServiceApplication.class, args);
|
|
|
|
|
|
}
|
|
|
|
|
|
|
|
|
|
|
|
}
|
|
|
|
|
|
|
|
|
|
|
|
```
|
|
|
|
|
|
|
|
|
|
|
|
最后启动应用。我们用 Postman 测试一下口,执行一次 Redis 查询操作,尝试跟踪该链路。
|
|
|
|
|
|
|
|
|
|
|
|
在 Zipkin 可视化 UI 中就可以看到刚才我们调用接口的链路数据了。
|
|
|
|
|
|
|
|
|
|
|
|
|
|
|
|
|
|
|
|
|
|
|
|
点开该链路,可以看到一个 Trace 明细。
|
|
|
|
|
|
|
|
|
|
|
|

|
|
|
|
|
|
|
|
|
|
|
|
到这里,我们的 Redis 组件链路跟踪也已经成功了。
|
|
|
|
|
|
|
|
|
|
|
|
### MongoDB
|
|
|
|
|
|
|
|
|
|
|
|
这里还是实现简单的 MongoDB 操作,我会使用 Spring Data MongoDB + MongoTemplate 进行 MongoDB 的操作。目前,Brave 默认提供了对 MongoDB 操作的链路跟踪,通过 [brave-instrumentation-mongo](https://github.com/openzipkin/brave/tree/master/instrumentation/mongodb) 库实现收集链路数据。
|
|
|
|
|
|
|
|
|
|
|
|
我们来看下具体的实现路径:
|
|
|
|
|
|
|
|
|
|
|
|
第一步,还是引入相关依赖。
|
|
|
|
|
|
|
|
|
|
|
|
```xml
|
|
|
|
|
|
<dependencies>
|
|
|
|
|
|
<!-- 引入 SpringMVC 相关依赖,并实现对其的自动配置 -->
|
|
|
|
|
|
<dependency>
|
|
|
|
|
|
<groupId>org.springframework.boot</groupId>
|
|
|
|
|
|
<artifactId>spring-boot-starter-web</artifactId>
|
|
|
|
|
|
</dependency>
|
|
|
|
|
|
<!-- 自动化配置 Spring Data Mongodb -->
|
|
|
|
|
|
<dependency>
|
|
|
|
|
|
<groupId>org.springframework.boot</groupId>
|
|
|
|
|
|
<artifactId>spring-boot-starter-data-mongodb</artifactId>
|
|
|
|
|
|
</dependency>
|
|
|
|
|
|
<!-- 引入 Zipkin 相关依赖 -->
|
|
|
|
|
|
<dependency>
|
|
|
|
|
|
<groupId>org.springframework.cloud</groupId>
|
|
|
|
|
|
<artifactId>spring-cloud-starter-zipkin</artifactId>
|
|
|
|
|
|
</dependency>
|
|
|
|
|
|
<!--添加 Sleuth 依赖 -->
|
|
|
|
|
|
<dependency>
|
|
|
|
|
|
<groupId>org.springframework.cloud</groupId>
|
|
|
|
|
|
<artifactId>spring-cloud-starter-sleuth</artifactId>
|
|
|
|
|
|
</dependency>
|
|
|
|
|
|
<!--添加 brave mongodb 依赖 -->
|
|
|
|
|
|
<dependency>
|
|
|
|
|
|
<groupId>io.zipkin.brave</groupId>
|
|
|
|
|
|
<artifactId>brave-instrumentation-mongodb</artifactId>
|
|
|
|
|
|
<version>5.13.3</version>
|
|
|
|
|
|
</dependency>
|
|
|
|
|
|
|
|
|
|
|
|
```
|
|
|
|
|
|
|
|
|
|
|
|
第二步,创建全局配置文件,添加MongoDB配置。
|
|
|
|
|
|
|
|
|
|
|
|
```yaml
|
|
|
|
|
|
spring:
|
|
|
|
|
|
application:
|
|
|
|
|
|
name: demo-service # 服务名
|
|
|
|
|
|
|
|
|
|
|
|
sleuth:
|
|
|
|
|
|
sampler: #采样器
|
|
|
|
|
|
probability: 1.0 #采样率,采样率是采集 Trace 的比率,默认 0.1
|
|
|
|
|
|
rate: 10000 #每秒数据采集量,最多 n 条/秒 Trace
|
|
|
|
|
|
web: # Web 组件的配置项,例如说 SpringMVC
|
|
|
|
|
|
enabled: true
|
|
|
|
|
|
|
|
|
|
|
|
zipkin: #设置 zipkin 服务端地址
|
|
|
|
|
|
base-url: http://127.0.0.1:9411
|
|
|
|
|
|
|
|
|
|
|
|
data:
|
|
|
|
|
|
# MongoDB 配置项,对应 MongoProperties 类
|
|
|
|
|
|
mongodb:
|
|
|
|
|
|
host: 127.0.0.1
|
|
|
|
|
|
port: 27017
|
|
|
|
|
|
database: demo
|
|
|
|
|
|
# username:
|
|
|
|
|
|
# password:
|
|
|
|
|
|
logging:
|
|
|
|
|
|
level:
|
|
|
|
|
|
root: debug #为演示需要,开启 debug 级别日志
|
|
|
|
|
|
|
|
|
|
|
|
```
|
|
|
|
|
|
|
|
|
|
|
|
第三步,创建 SleuthConfiguration 配置类,创建一个 [TraceMongoCommandListener](https://github.com/openzipkin/brave/blob/master/instrumentation/mongodb/src/main/java/brave/mongodb/TraceMongoCommandListener.java) Bean 对象。这样,我们就能拦截到 MongoDB 操作,进行相应的链路跟踪了。
|
|
|
|
|
|
|
|
|
|
|
|
```java
|
|
|
|
|
|
package com.dunshan.mongodbdemo.config;
|
|
|
|
|
|
|
|
|
|
|
|
import brave.Tracer;
|
|
|
|
|
|
import brave.Tracing;
|
|
|
|
|
|
import brave.mongodb.MongoDBTracing;
|
|
|
|
|
|
import com.mongodb.MongoClientSettings;
|
|
|
|
|
|
import com.mongodb.client.MongoClient;
|
|
|
|
|
|
import com.mongodb.client.MongoClients;
|
|
|
|
|
|
import com.mongodb.event.CommandListener;
|
|
|
|
|
|
import org.springframework.context.annotation.Bean;
|
|
|
|
|
|
import org.springframework.context.annotation.Configuration;
|
|
|
|
|
|
|
|
|
|
|
|
@Configuration
|
|
|
|
|
|
public class SleuthConfiguration {
|
|
|
|
|
|
|
|
|
|
|
|
@Bean
|
|
|
|
|
|
public MongoClient mongoClient(Tracer tracer) {
|
|
|
|
|
|
CommandListener listener = MongoDBTracing.create(Tracing.current())
|
|
|
|
|
|
.commandListener();
|
|
|
|
|
|
MongoClientSettings settings = MongoClientSettings.builder()
|
|
|
|
|
|
.addCommandListener(listener)
|
|
|
|
|
|
.build();
|
|
|
|
|
|
MongoClient client = MongoClients.create(settings);
|
|
|
|
|
|
return client;
|
|
|
|
|
|
}
|
|
|
|
|
|
|
|
|
|
|
|
}
|
|
|
|
|
|
|
|
|
|
|
|
```
|
|
|
|
|
|
|
|
|
|
|
|
第四步,创建 DemoController 类,提供示例 API 接口。
|
|
|
|
|
|
|
|
|
|
|
|
```java
|
|
|
|
|
|
package com.dunshan.mongodbdemo.controller;
|
|
|
|
|
|
|
|
|
|
|
|
import org.springframework.beans.factory.annotation.Autowired;
|
|
|
|
|
|
import org.springframework.data.mongodb.core.MongoTemplate;
|
|
|
|
|
|
import org.springframework.data.mongodb.core.query.Criteria;
|
|
|
|
|
|
import org.springframework.data.mongodb.core.query.Query;
|
|
|
|
|
|
import org.springframework.web.bind.annotation.GetMapping;
|
|
|
|
|
|
import org.springframework.web.bind.annotation.RequestMapping;
|
|
|
|
|
|
import org.springframework.web.bind.annotation.RequestParam;
|
|
|
|
|
|
import org.springframework.web.bind.annotation.RestController;
|
|
|
|
|
|
|
|
|
|
|
|
@RestController
|
|
|
|
|
|
@RequestMapping("/7d")
|
|
|
|
|
|
public class DemoController {
|
|
|
|
|
|
|
|
|
|
|
|
@Autowired
|
|
|
|
|
|
private MongoTemplate mongoTemplate;
|
|
|
|
|
|
|
|
|
|
|
|
@GetMapping("/get")
|
|
|
|
|
|
public String get(@RequestParam("id") Integer id) {
|
|
|
|
|
|
this.findById(1);
|
|
|
|
|
|
return "success";
|
|
|
|
|
|
}
|
|
|
|
|
|
|
|
|
|
|
|
public DemoDO findById(Integer id) {
|
|
|
|
|
|
return mongoTemplate.findOne(new Query(Criteria.where("_id").is(id)), DemoDO.class);
|
|
|
|
|
|
}
|
|
|
|
|
|
|
|
|
|
|
|
}
|
|
|
|
|
|
|
|
|
|
|
|
|
|
|
|
|
|
```
|
|
|
|
|
|
|
|
|
|
|
|
我们可以请求 /7d/get 接口,执行一次 MongoDB 的查询。
|
|
|
|
|
|
|
|
|
|
|
|
第五步,创建 DemoServiceApplication 启动类。
|
|
|
|
|
|
|
|
|
|
|
|
```java
|
|
|
|
|
|
package com.dunshan.mongodbdemo;
|
|
|
|
|
|
|
|
|
|
|
|
import org.springframework.boot.SpringApplication;
|
|
|
|
|
|
import org.springframework.boot.autoconfigure.SpringBootApplication;
|
|
|
|
|
|
|
|
|
|
|
|
@SpringBootApplication
|
|
|
|
|
|
public class DemoServiceApplication {
|
|
|
|
|
|
|
|
|
|
|
|
public static void main(String[] args) {
|
|
|
|
|
|
SpringApplication.run(DemoServiceApplication.class, args);
|
|
|
|
|
|
}
|
|
|
|
|
|
|
|
|
|
|
|
}
|
|
|
|
|
|
|
|
|
|
|
|
```
|
|
|
|
|
|
|
|
|
|
|
|
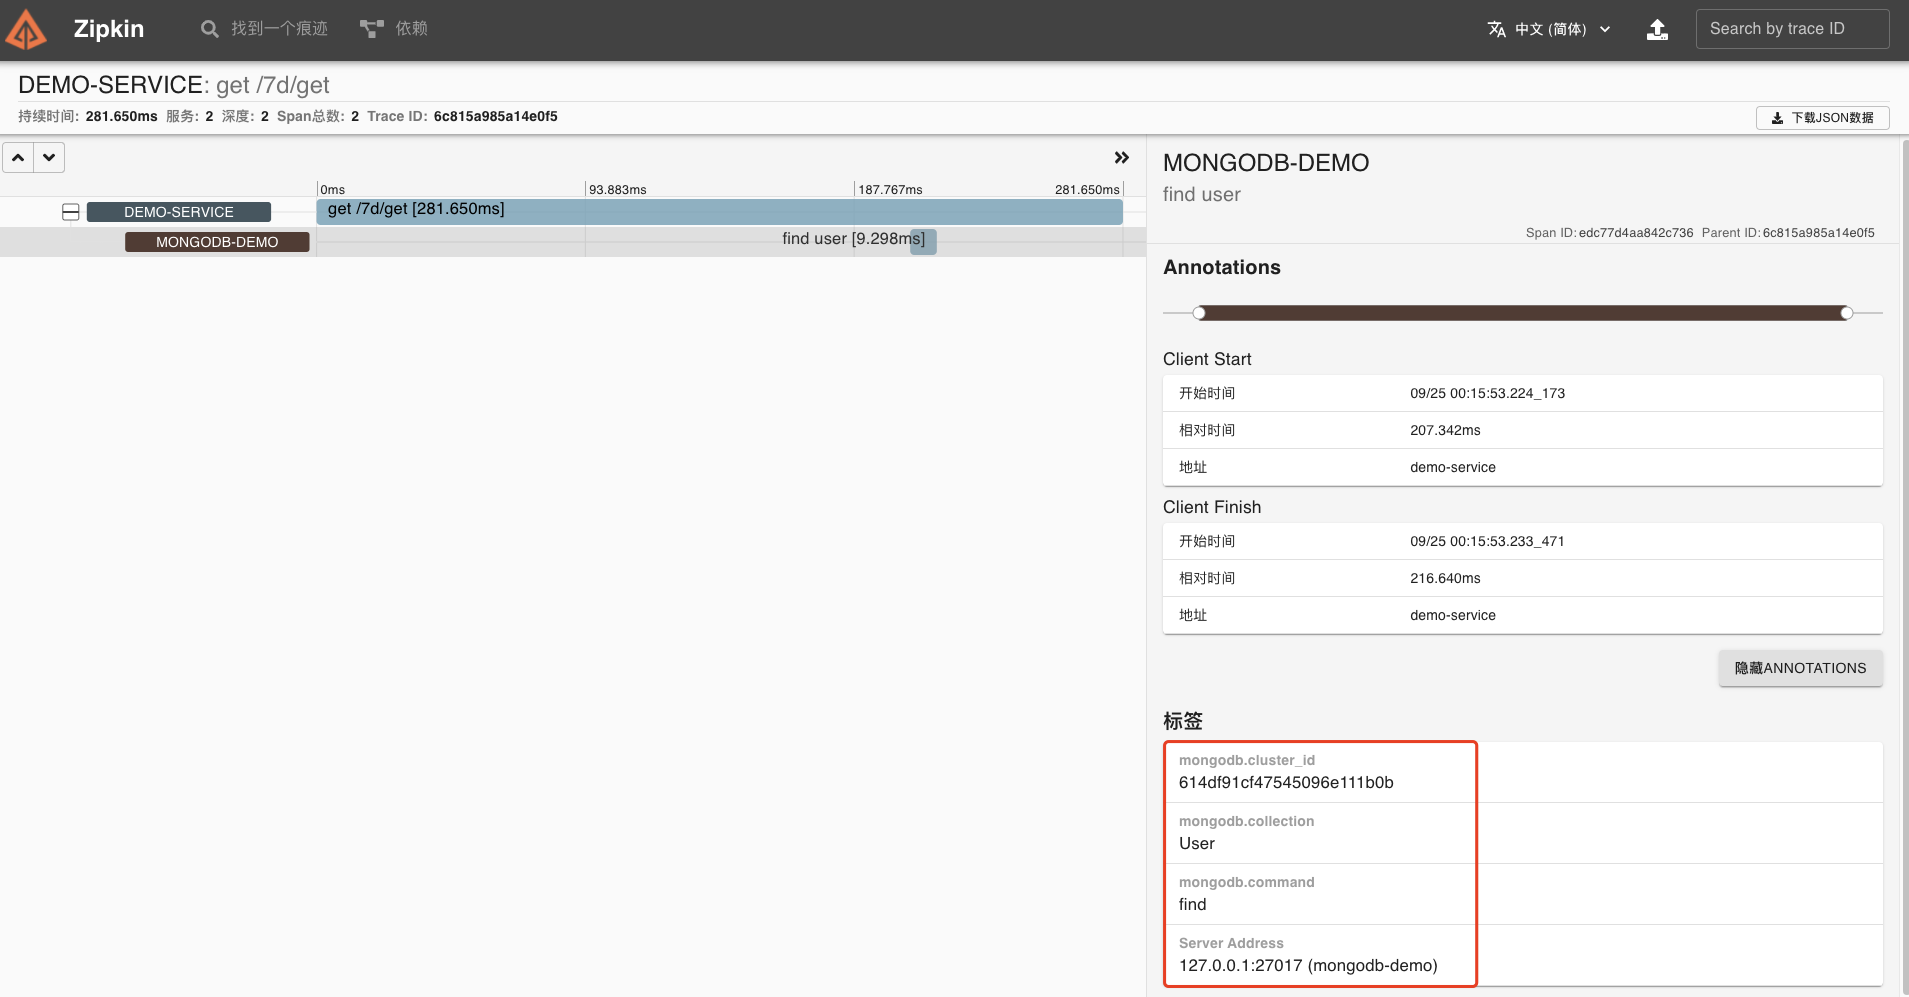
最后启动应用。我们使用 Postman 测试接口,执行一次 MongoDB 查询操作,尝试跟踪该链路。
|
|
|
|
|
|
|
|
|
|
|
|
在 Zipkin 可视化 UI 中可以看到刚才我们调用接口的链路数据。
|
|
|
|
|
|
|
|
|
|
|
|
|
|
|
|
|
|
|
|
|
|
|
|
点开该链路,可以看到一个 Trace 明细。
|
|
|
|
|
|
|
|
|
|
|
|
|
|
|
|
|
|
|
|
|
|
|
|
我们的 MongoDB 组件链路跟踪也已经成功了。
|
|
|
|
|
|
|
|
|
|
|
|
### RabbitMQ
|
|
|
|
|
|
|
|
|
|
|
|
因为 [Brave](https://github.com/openzipkin/brave) 库也默认提供了 RabbitMQ 链路追踪的功能,所以同样只需要集成就可以了。
|
|
|
|
|
|
|
|
|
|
|
|
顺便提下 ,Brave 主要通过两个插件实现链路数据收集,它们分别是:
|
|
|
|
|
|
|
|
|
|
|
|
* [brave-instrumentation-messaging](https://github.com/openzipkin/brave/tree/master/instrumentation/messaging)
|
|
|
|
|
|
* [brave-instrumentation-spring-rabbit](https://github.com/openzipkin/brave/blob/master/instrumentation/spring-rabbit/)
|
|
|
|
|
|
|
|
|
|
|
|
**搭建生产者示例**
|
|
|
|
|
|
|
|
|
|
|
|
第一步,还是引入相关依赖。
|
|
|
|
|
|
|
|
|
|
|
|
```xml
|
|
|
|
|
|
<dependencies>
|
|
|
|
|
|
<!-- 引入 SpringMVC 相关依赖,并实现对其的自动配置 -->
|
|
|
|
|
|
<dependency>
|
|
|
|
|
|
<groupId>org.springframework.boot</groupId>
|
|
|
|
|
|
<artifactId>spring-boot-starter-web</artifactId>
|
|
|
|
|
|
</dependency>
|
|
|
|
|
|
<!-- 引入 Spring Cloud Stream RabbitMQ 相关依赖,将 RabbitMQ 作为消息队列,并实现对其的自动配置 -->
|
|
|
|
|
|
<dependency>
|
|
|
|
|
|
<groupId>org.springframework.cloud</groupId>
|
|
|
|
|
|
<artifactId>spring-cloud-starter-stream-rabbit</artifactId>
|
|
|
|
|
|
</dependency>
|
|
|
|
|
|
<!-- 引入 Zipkin 依赖-->
|
|
|
|
|
|
<dependency>
|
|
|
|
|
|
<groupId>org.springframework.cloud</groupId>
|
|
|
|
|
|
<artifactId>spring-cloud-starter-zipkin</artifactId>
|
|
|
|
|
|
</dependency>
|
|
|
|
|
|
<!--添加 Sleuth 依赖 -->
|
|
|
|
|
|
<dependency>
|
|
|
|
|
|
<groupId>org.springframework.cloud</groupId>
|
|
|
|
|
|
<artifactId>spring-cloud-starter-sleuth</artifactId>
|
|
|
|
|
|
</dependency>
|
|
|
|
|
|
</dependencies>
|
|
|
|
|
|
|
|
|
|
|
|
```
|
|
|
|
|
|
|
|
|
|
|
|
第二步,创建全局配置文件,添加RabbitMQ配置。
|
|
|
|
|
|
|
|
|
|
|
|
```yaml
|
|
|
|
|
|
spring:
|
|
|
|
|
|
application:
|
|
|
|
|
|
name: demo-producer
|
|
|
|
|
|
cloud:
|
|
|
|
|
|
# Spring Cloud Stream 配置项,对应 BindingServiceProperties 类
|
|
|
|
|
|
stream:
|
|
|
|
|
|
# Binder 配置项,对应 BinderProperties Map
|
|
|
|
|
|
binders:
|
|
|
|
|
|
demo:
|
|
|
|
|
|
type: rabbit # 设置 Binder 的类型
|
|
|
|
|
|
environment: # 设置 Binder 的环境配置
|
|
|
|
|
|
# 如果是 RabbitMQ 类型的时候,则对应的是 RabbitProperties 类
|
|
|
|
|
|
spring:
|
|
|
|
|
|
rabbitmq:
|
|
|
|
|
|
host: 127.0.0.1 # 服务地址
|
|
|
|
|
|
port: 5672 # 服务端口
|
|
|
|
|
|
username: guest # 服务账号
|
|
|
|
|
|
password: guest # 服务密码
|
|
|
|
|
|
# Binding 配置项,对应 BindingProperties Map
|
|
|
|
|
|
bindings:
|
|
|
|
|
|
demo-output:
|
|
|
|
|
|
destination: DEMO-TOPIC # 目的地,使用 RabbitMQ Exchange
|
|
|
|
|
|
content-type: application/json # 内容格式
|
|
|
|
|
|
binder: demo # 设置使用的 Binder 名字
|
|
|
|
|
|
sleuth:
|
|
|
|
|
|
sampler: #采样器
|
|
|
|
|
|
probability: 1.0 #采样率,采样率是采集 Trace 的比率,默认 0.1
|
|
|
|
|
|
rate: 10000 #每秒数据采集量,最多 n 条/秒 Trace
|
|
|
|
|
|
messaging:
|
|
|
|
|
|
# Spring Cloud Sleuth 针对 RabbitMQ 组件的配置项
|
|
|
|
|
|
rabbit:
|
|
|
|
|
|
enabled: true # 是否开启
|
|
|
|
|
|
remote-service-name: rabbitmq # 远程服务名,默认为 rabbitmq
|
|
|
|
|
|
zipkin: #设置 zipkin 服务端地址
|
|
|
|
|
|
base-url: http://127.0.0.1:9411
|
|
|
|
|
|
|
|
|
|
|
|
server:
|
|
|
|
|
|
port: 18080
|
|
|
|
|
|
|
|
|
|
|
|
```
|
|
|
|
|
|
|
|
|
|
|
|
第三步,创建 MySource 接口,声明名字为 Output Binding。
|
|
|
|
|
|
|
|
|
|
|
|
```java
|
|
|
|
|
|
package com.dunshan.rabbitmqdemo.producerdemo.message;
|
|
|
|
|
|
|
|
|
|
|
|
import org.springframework.cloud.stream.annotation.Output;
|
|
|
|
|
|
import org.springframework.messaging.MessageChannel;
|
|
|
|
|
|
|
|
|
|
|
|
public interface MySource {
|
|
|
|
|
|
|
|
|
|
|
|
@Output("demo-output")
|
|
|
|
|
|
MessageChannel demoOutput();
|
|
|
|
|
|
|
|
|
|
|
|
}
|
|
|
|
|
|
|
|
|
|
|
|
```
|
|
|
|
|
|
|
|
|
|
|
|
第四步,创建 DemoMessage 类,示例 Message 消息。
|
|
|
|
|
|
|
|
|
|
|
|
```java
|
|
|
|
|
|
package com.dunshan.rabbitmqdemo.producerdemo.message;
|
|
|
|
|
|
|
|
|
|
|
|
/**
|
|
|
|
|
|
* 示例 Message 消息
|
|
|
|
|
|
*/
|
|
|
|
|
|
public class DemoMessage {
|
|
|
|
|
|
|
|
|
|
|
|
/**
|
|
|
|
|
|
* 编号
|
|
|
|
|
|
*/
|
|
|
|
|
|
private Integer id;
|
|
|
|
|
|
|
|
|
|
|
|
public DemoMessage setId(Integer id) {
|
|
|
|
|
|
this.id = id;
|
|
|
|
|
|
return this;
|
|
|
|
|
|
}
|
|
|
|
|
|
|
|
|
|
|
|
public Integer getId() {
|
|
|
|
|
|
return id;
|
|
|
|
|
|
}
|
|
|
|
|
|
|
|
|
|
|
|
@Override
|
|
|
|
|
|
public String toString() {
|
|
|
|
|
|
return "DemoMessage{" +
|
|
|
|
|
|
"id=" + id +
|
|
|
|
|
|
'}';
|
|
|
|
|
|
}
|
|
|
|
|
|
|
|
|
|
|
|
}
|
|
|
|
|
|
|
|
|
|
|
|
```
|
|
|
|
|
|
|
|
|
|
|
|
第五步,创建 DemoController 类,提供示例 API 接口。
|
|
|
|
|
|
|
|
|
|
|
|
```java
|
|
|
|
|
|
package com.dunshan.rabbitmqdemo.producerdemo.controller;
|
|
|
|
|
|
|
|
|
|
|
|
import org.slf4j.Logger;
|
|
|
|
|
|
import org.slf4j.LoggerFactory;
|
|
|
|
|
|
import org.springframework.beans.factory.annotation.Autowired;
|
|
|
|
|
|
import org.springframework.messaging.Message;
|
|
|
|
|
|
import org.springframework.messaging.support.MessageBuilder;
|
|
|
|
|
|
import org.springframework.web.bind.annotation.GetMapping;
|
|
|
|
|
|
import org.springframework.web.bind.annotation.RequestMapping;
|
|
|
|
|
|
import org.springframework.web.bind.annotation.RestController;
|
|
|
|
|
|
|
|
|
|
|
|
import java.util.Random;
|
|
|
|
|
|
|
|
|
|
|
|
@RestController
|
|
|
|
|
|
@RequestMapping("/7d")
|
|
|
|
|
|
public class DemoController {
|
|
|
|
|
|
|
|
|
|
|
|
private Logger logger = LoggerFactory.getLogger(getClass());
|
|
|
|
|
|
|
|
|
|
|
|
@Autowired
|
|
|
|
|
|
private MySource mySource;
|
|
|
|
|
|
|
|
|
|
|
|
@GetMapping("/send")
|
|
|
|
|
|
public boolean send() {
|
|
|
|
|
|
// 创建 Message
|
|
|
|
|
|
DemoMessage message = new DemoMessage()
|
|
|
|
|
|
.setId(new Random().nextInt());
|
|
|
|
|
|
// 创建 Spring Message 对象
|
|
|
|
|
|
Message<DemoMessage> springMessage = MessageBuilder.withPayload(message)
|
|
|
|
|
|
.build();
|
|
|
|
|
|
// 发送消息
|
|
|
|
|
|
return mySource.demoOutput().send(springMessage);
|
|
|
|
|
|
}
|
|
|
|
|
|
|
|
|
|
|
|
}
|
|
|
|
|
|
|
|
|
|
|
|
```
|
|
|
|
|
|
|
|
|
|
|
|
我们可以请求 /7d/send 接口,执行一次发送消费。
|
|
|
|
|
|
|
|
|
|
|
|
第六步,创建 DemoServiceApplication 启动类。
|
|
|
|
|
|
|
|
|
|
|
|
```java
|
|
|
|
|
|
package com.dunshan.rabbitmqdemo.producerdemo;
|
|
|
|
|
|
|
|
|
|
|
|
import org.springframework.boot.SpringApplication;
|
|
|
|
|
|
import org.springframework.boot.autoconfigure.SpringBootApplication;
|
|
|
|
|
|
import org.springframework.cloud.stream.annotation.EnableBinding;
|
|
|
|
|
|
|
|
|
|
|
|
@SpringBootApplication
|
|
|
|
|
|
@EnableBinding(MySource.class)
|
|
|
|
|
|
public class ProducerApplication {
|
|
|
|
|
|
|
|
|
|
|
|
public static void main(String[] args) {
|
|
|
|
|
|
SpringApplication.run(ProducerApplication.class, args);
|
|
|
|
|
|
}
|
|
|
|
|
|
|
|
|
|
|
|
}
|
|
|
|
|
|
|
|
|
|
|
|
```
|
|
|
|
|
|
|
|
|
|
|
|
这样,我们的生产者示例就搭建完了。
|
|
|
|
|
|
|
|
|
|
|
|
**搭建消费者示例**
|
|
|
|
|
|
|
|
|
|
|
|
第一步,还是引入相关依赖。
|
|
|
|
|
|
|
|
|
|
|
|
```xml
|
|
|
|
|
|
<dependencies>
|
|
|
|
|
|
<!-- 引入 SpringMVC 相关依赖,并实现对其的自动配置 -->
|
|
|
|
|
|
<dependency>
|
|
|
|
|
|
<groupId>org.springframework.boot</groupId>
|
|
|
|
|
|
<artifactId>spring-boot-starter-web</artifactId>
|
|
|
|
|
|
</dependency>
|
|
|
|
|
|
<!-- 引入 Spring Cloud Stream RabbitMQ 相关依赖,将 RabbitMQ 作为消息队列,并实现对其的自动配置 -->
|
|
|
|
|
|
<dependency>
|
|
|
|
|
|
<groupId>org.springframework.cloud</groupId>
|
|
|
|
|
|
<artifactId>spring-cloud-starter-stream-rabbit</artifactId>
|
|
|
|
|
|
</dependency>
|
|
|
|
|
|
<!-- 引入 Zipkin 依赖-->
|
|
|
|
|
|
<dependency>
|
|
|
|
|
|
<groupId>org.springframework.cloud</groupId>
|
|
|
|
|
|
<artifactId>spring-cloud-starter-zipkin</artifactId>
|
|
|
|
|
|
</dependency>
|
|
|
|
|
|
<!--添加 Sleuth 依赖 -->
|
|
|
|
|
|
<dependency>
|
|
|
|
|
|
<groupId>org.springframework.cloud</groupId>
|
|
|
|
|
|
<artifactId>spring-cloud-starter-sleuth</artifactId>
|
|
|
|
|
|
</dependency>
|
|
|
|
|
|
</dependencies>
|
|
|
|
|
|
|
|
|
|
|
|
```
|
|
|
|
|
|
|
|
|
|
|
|
第二步,创建全局配置文件,添加相关数据库配置。
|
|
|
|
|
|
|
|
|
|
|
|
```yaml
|
|
|
|
|
|
spring:
|
|
|
|
|
|
application:
|
|
|
|
|
|
name: demo-consumer
|
|
|
|
|
|
cloud:
|
|
|
|
|
|
# Spring Cloud Stream 配置项,对应 BindingServiceProperties 类
|
|
|
|
|
|
stream:
|
|
|
|
|
|
# Binder 配置项,对应 BinderProperties Map
|
|
|
|
|
|
binders:
|
|
|
|
|
|
demo:
|
|
|
|
|
|
type: rabbit # 设置 Binder 的类型
|
|
|
|
|
|
environment: # 设置 Binder 的环境配置
|
|
|
|
|
|
# 如果是 RabbitMQ 类型的时候,则对应的是 RabbitProperties 类
|
|
|
|
|
|
spring:
|
|
|
|
|
|
rabbitmq:
|
|
|
|
|
|
host: 127.0.0.1 # RabbitMQ 服务的地址
|
|
|
|
|
|
port: 5672 # RabbitMQ 服务的端口
|
|
|
|
|
|
username: guest # 服务账号
|
|
|
|
|
|
password: guest # 服务密码
|
|
|
|
|
|
# Binding 配置项,对应 BindingProperties Map
|
|
|
|
|
|
bindings:
|
|
|
|
|
|
demo01-input:
|
|
|
|
|
|
destination: DEMO-TOPIC # 目的地。这里使用 RabbitMQ Exchange
|
|
|
|
|
|
content-type: application/json # 内容格式。这里使用 JSON
|
|
|
|
|
|
group: demo-consumer-group-DEMO-TOPIC # 消费者分组
|
|
|
|
|
|
binder: demo # 设置使用的 Binder 名字
|
|
|
|
|
|
|
|
|
|
|
|
sleuth:
|
|
|
|
|
|
sampler: #采样器
|
|
|
|
|
|
probability: 1.0 #采样率,采样率是采集 Trace 的比率,默认 0.1
|
|
|
|
|
|
rate: 10000 #每秒数据采集量,最多 n 条/秒 Trace
|
|
|
|
|
|
messaging:
|
|
|
|
|
|
# Spring Cloud Sleuth 针对 RabbitMQ 组件的配置项
|
|
|
|
|
|
rabbit:
|
|
|
|
|
|
enabled: true # 是否开启
|
|
|
|
|
|
remote-service-name: rabbitmq # 远程服务名,默认为 rabbitmq
|
|
|
|
|
|
zipkin: #设置 zipkin 服务端地址
|
|
|
|
|
|
base-url: http://127.0.0.1:9411
|
|
|
|
|
|
|
|
|
|
|
|
server:
|
|
|
|
|
|
port: ${random.int[10000,19999]} # 随机端口,方便启动多个消费者
|
|
|
|
|
|
|
|
|
|
|
|
```
|
|
|
|
|
|
|
|
|
|
|
|
spring.sleuth.messaging.rabbit 是 Spring Cloud Sleuth 针对 RabbitMQ 组件的配置项,对应 [SleuthMessagingProperties.Rabbit](https://github.com/spring-cloud/spring-cloud-sleuth/blob/master/spring-cloud-sleuth-core/src/main/java/org/springframework/cloud/sleuth/instrument/messaging/SleuthMessagingProperties.java#L150-L175) 类。
|
|
|
|
|
|
|
|
|
|
|
|
* enabled 配置项,是否开启,默认为 true。
|
|
|
|
|
|
* remote-service-name 配置项,远程服务名,默认为 rabbitmq。
|
|
|
|
|
|
|
|
|
|
|
|
第三步,创建 MySink 接口,声明名字为 Intput Binding。
|
|
|
|
|
|
|
|
|
|
|
|
```java
|
|
|
|
|
|
package com.dunshan.rabbitmqdemo.consumerdemo.listener;
|
|
|
|
|
|
|
|
|
|
|
|
import org.springframework.cloud.stream.annotation.Input;
|
|
|
|
|
|
import org.springframework.messaging.SubscribableChannel;
|
|
|
|
|
|
|
|
|
|
|
|
public interface MySink {
|
|
|
|
|
|
|
|
|
|
|
|
String DEMO_INPUT = "demo-input";
|
|
|
|
|
|
|
|
|
|
|
|
@Input(DEMO_INPUT)
|
|
|
|
|
|
SubscribableChannel demoInput();
|
|
|
|
|
|
|
|
|
|
|
|
}
|
|
|
|
|
|
|
|
|
|
|
|
```
|
|
|
|
|
|
|
|
|
|
|
|
第四步,创建 DemoMessage 类,示例 Message 消息。
|
|
|
|
|
|
|
|
|
|
|
|
```java
|
|
|
|
|
|
package com.dunshan.rabbitmqdemo.consumerdemo.message;
|
|
|
|
|
|
|
|
|
|
|
|
/**
|
|
|
|
|
|
* 示例 Message 消息
|
|
|
|
|
|
*/
|
|
|
|
|
|
public class DemoMessage {
|
|
|
|
|
|
|
|
|
|
|
|
/**
|
|
|
|
|
|
* 编号
|
|
|
|
|
|
*/
|
|
|
|
|
|
private Integer id;
|
|
|
|
|
|
|
|
|
|
|
|
public DemoMessage setId(Integer id) {
|
|
|
|
|
|
this.id = id;
|
|
|
|
|
|
return this;
|
|
|
|
|
|
}
|
|
|
|
|
|
|
|
|
|
|
|
public Integer getId() {
|
|
|
|
|
|
return id;
|
|
|
|
|
|
}
|
|
|
|
|
|
|
|
|
|
|
|
@Override
|
|
|
|
|
|
public String toString() {
|
|
|
|
|
|
return "DemoMessage{" +
|
|
|
|
|
|
"id=" + id +
|
|
|
|
|
|
'}';
|
|
|
|
|
|
}
|
|
|
|
|
|
|
|
|
|
|
|
}
|
|
|
|
|
|
|
|
|
|
|
|
```
|
|
|
|
|
|
|
|
|
|
|
|
第五步,创建 DemoConsumer 类,消费消息。
|
|
|
|
|
|
|
|
|
|
|
|
```java
|
|
|
|
|
|
package com.dunshan.rabbitmqdemo.consumerdemo.listener;
|
|
|
|
|
|
|
|
|
|
|
|
import org.slf4j.Logger;
|
|
|
|
|
|
import org.slf4j.LoggerFactory;
|
|
|
|
|
|
import org.springframework.cloud.stream.annotation.StreamListener;
|
|
|
|
|
|
import org.springframework.messaging.handler.annotation.Payload;
|
|
|
|
|
|
import org.springframework.stereotype.Component;
|
|
|
|
|
|
|
|
|
|
|
|
@Component
|
|
|
|
|
|
public class DemoConsumer {
|
|
|
|
|
|
|
|
|
|
|
|
private Logger logger = LoggerFactory.getLogger(getClass());
|
|
|
|
|
|
|
|
|
|
|
|
@StreamListener(MySink.DEMO_INPUT)
|
|
|
|
|
|
public void onMessage(@Payload DemoMessage message) {
|
|
|
|
|
|
logger.info("[onMessage][线程编号:{} 消息内容:{}]", Thread.currentThread().getId(), message);
|
|
|
|
|
|
}
|
|
|
|
|
|
|
|
|
|
|
|
}
|
|
|
|
|
|
|
|
|
|
|
|
```
|
|
|
|
|
|
|
|
|
|
|
|
第六步,创建 DemoServiceApplication 启动类。
|
|
|
|
|
|
|
|
|
|
|
|
```java
|
|
|
|
|
|
package com.dunshan.rabbitmqdemo.consumerdemo;
|
|
|
|
|
|
|
|
|
|
|
|
import org.springframework.boot.SpringApplication;
|
|
|
|
|
|
import org.springframework.boot.autoconfigure.SpringBootApplication;
|
|
|
|
|
|
import org.springframework.cloud.stream.annotation.EnableBinding;
|
|
|
|
|
|
|
|
|
|
|
|
@SpringBootApplication
|
|
|
|
|
|
@EnableBinding(MySink.class)
|
|
|
|
|
|
public class ConsumerApplication {
|
|
|
|
|
|
|
|
|
|
|
|
public static void main(String[] args) {
|
|
|
|
|
|
SpringApplication.run(ConsumerApplication.class, args);
|
|
|
|
|
|
}
|
|
|
|
|
|
|
|
|
|
|
|
}
|
|
|
|
|
|
|
|
|
|
|
|
```
|
|
|
|
|
|
|
|
|
|
|
|
最后,启动应用。我们使用 Postman 测试一下接口,发送一条消息,尝试跟踪该链路。
|
|
|
|
|
|
|
|
|
|
|
|
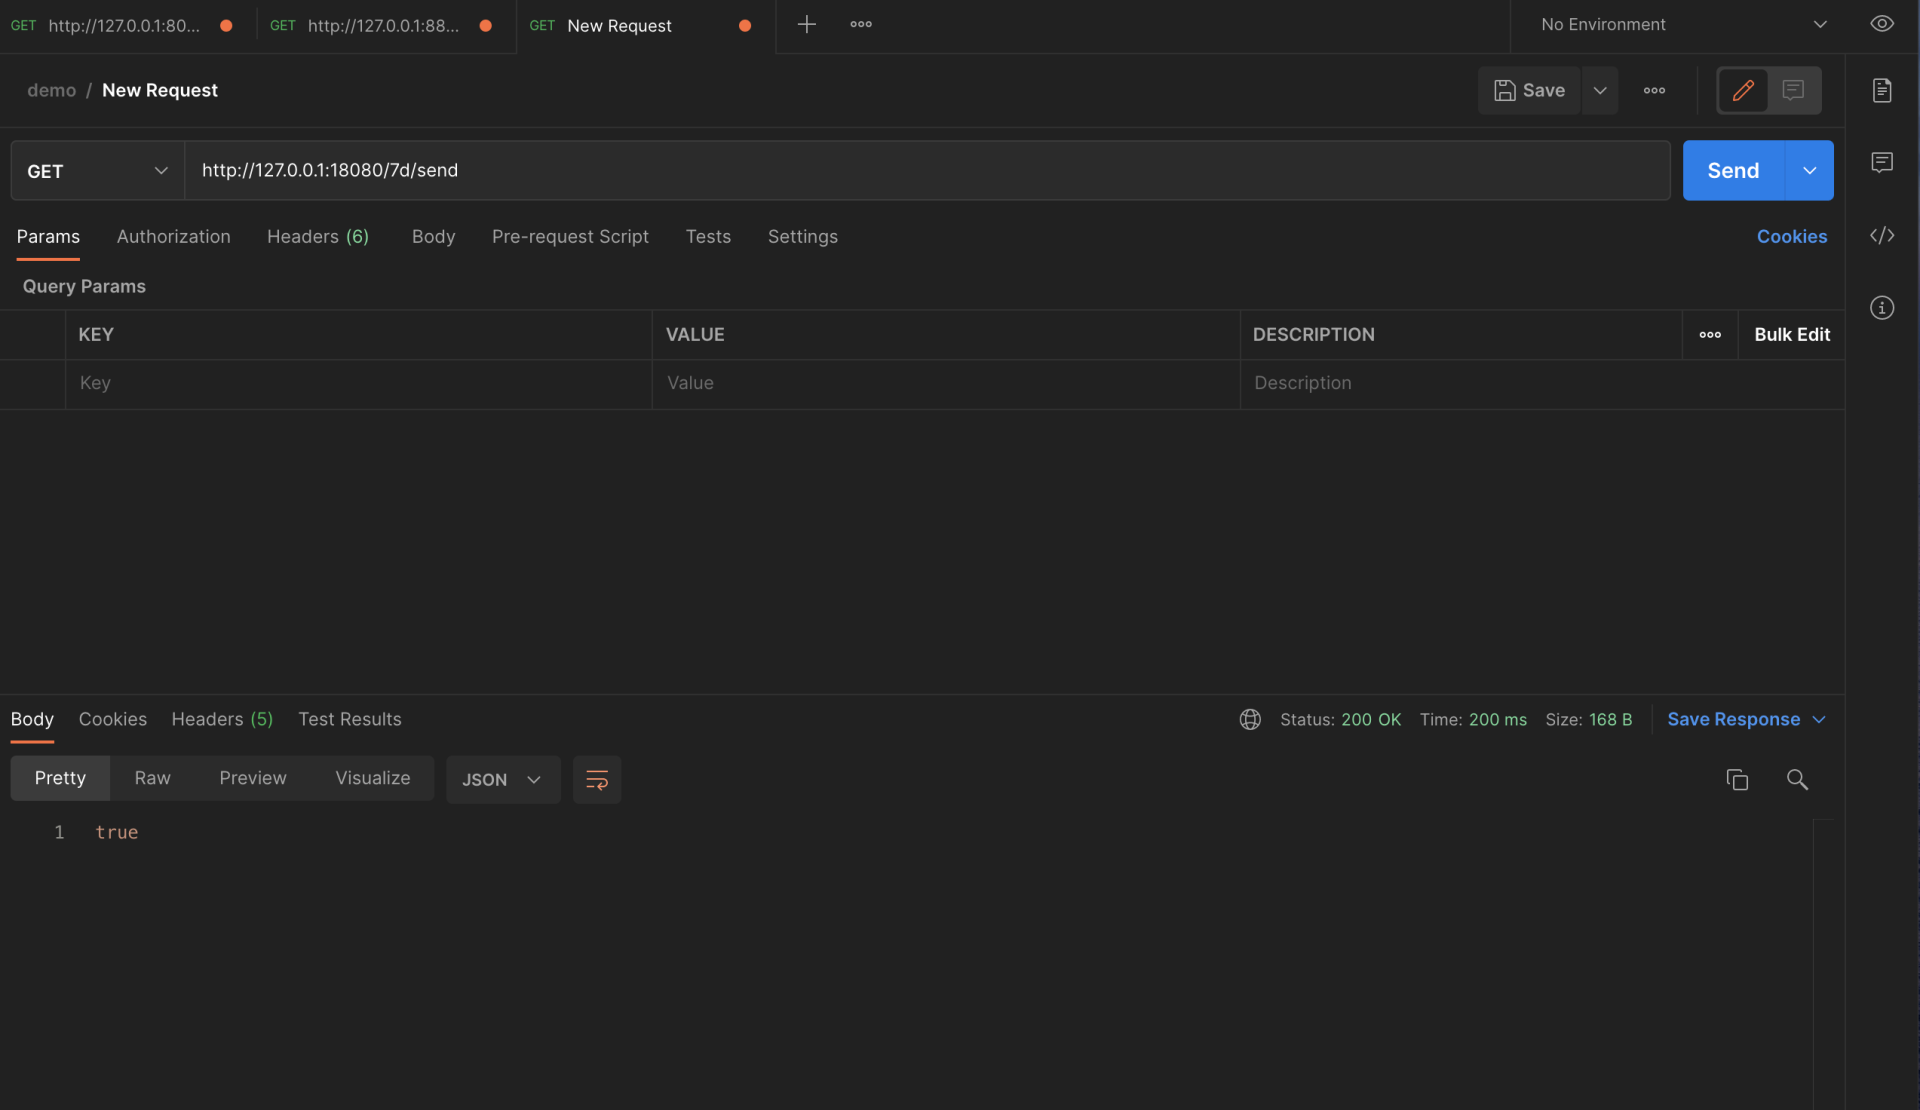
|
|
|
|
|
|
|
|
|
|
|
|
查看结果,在 Zipkin 已经可以看到刚才我们调用接口的链路数据了。
|
|
|
|
|
|
|
|
|
|
|
|
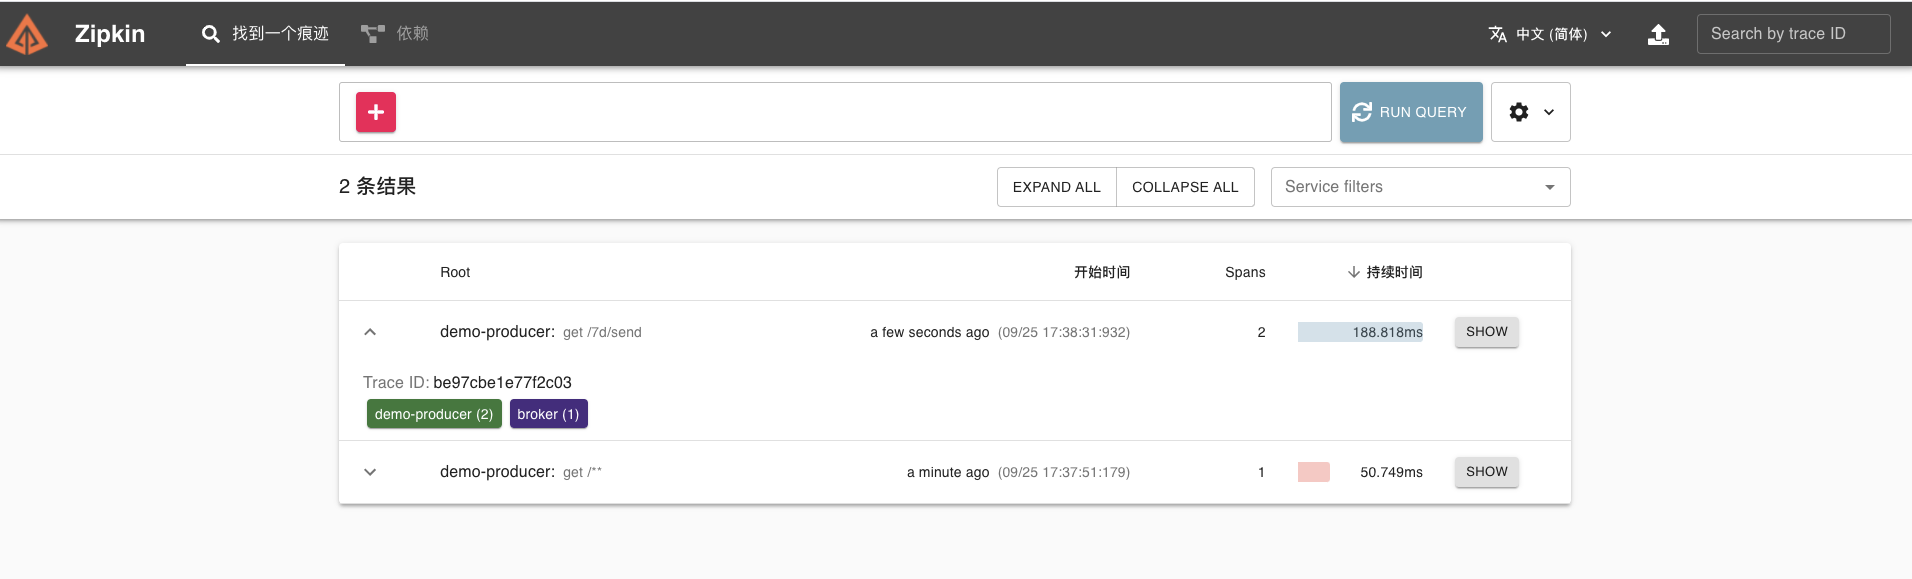
|
|
|
|
|
|
|
|
|
|
|
|
点开该链路可以看到一个 Trace 明细。
|
|
|
|
|
|
|
|
|
|
|
|
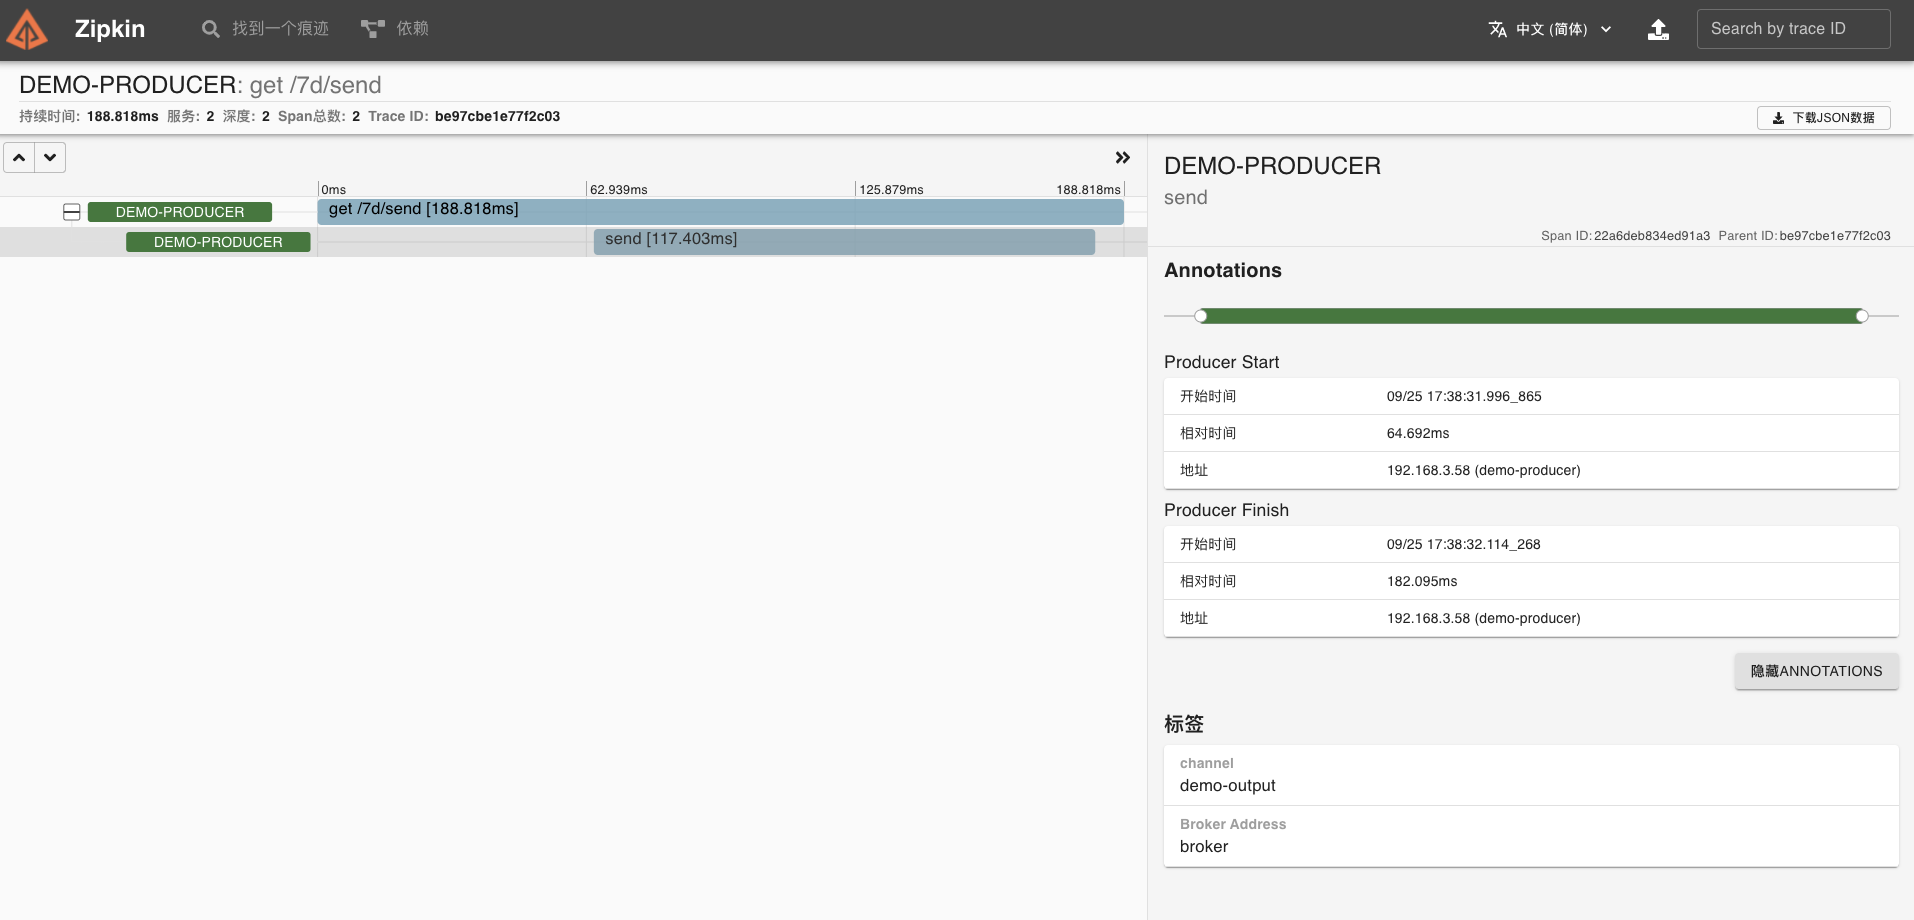
|
|
|
|
|
|
|
|
|
|
|
|
到这里,我们的 RabbitMQ 组件链路跟踪也成功了。
|
|
|
|
|
|
|
|
|
|
|
|
刚才,我对所有的技术组件都单独进行了 demo 预演。单就这个过程来说,改造的复杂度还是可以接受的。接下来我们就一起来看看,怎么让它们在真实项目中落地。
|
|
|
|
|
|
|
|
|
|
|
|
## 系统改造
|
|
|
|
|
|
|
|
|
|
|
|
### 服务改造
|
|
|
|
|
|
|
|
|
|
|
|
我这里主要介绍三个服务的改造过程(其他服务是类似的操作),它们分别是:
|
|
|
|
|
|
|
|
|
|
|
|
1. mall-gateway,API 网关
|
|
|
|
|
|
2. mall-auth,认证中心服务
|
|
|
|
|
|
3. mall-member,会员系统服务
|
|
|
|
|
|
|
|
|
|
|
|
mall-gateway 主要使用的是 Spring Cloud Gateway 技术,我们这个项目的主要用途是路由匹配、请求统一校验认证和鉴权。
|
|
|
|
|
|
|
|
|
|
|
|
大致的执行流程可以参考[下图](https://docs.spring.io/spring-cloud-gateway/docs/current/reference/html)。
|
|
|
|
|
|
|
|
|
|
|
|
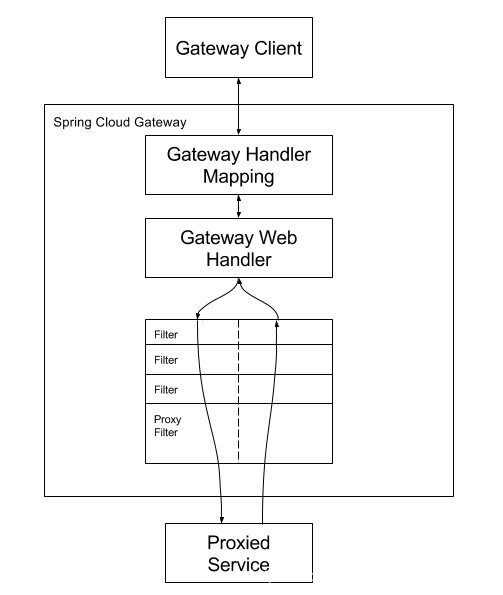
|
|
|
|
|
|
|
|
|
|
|
|
通过上面的介绍,我们知道 Sleuth 原生就支持对 Spring Cloud Gateway 链路追踪,所以我们只需要集成就可以了。
|
|
|
|
|
|
|
|
|
|
|
|
我们在 pom.xml 文件引入相关依赖。
|
|
|
|
|
|
|
|
|
|
|
|
```xml
|
|
|
|
|
|
<dependencies>
|
|
|
|
|
|
<!-- 引入 Spring Cloud Gateway 相关依赖-->
|
|
|
|
|
|
<dependency>
|
|
|
|
|
|
<groupId>org.springframework.cloud</groupId>
|
|
|
|
|
|
<artifactId>spring-cloud-starter-gateway</artifactId>
|
|
|
|
|
|
</dependency>
|
|
|
|
|
|
<!-- 引入 Zipkin 依赖-->
|
|
|
|
|
|
<dependency>
|
|
|
|
|
|
<groupId>org.springframework.cloud</groupId>
|
|
|
|
|
|
<artifactId>spring-cloud-starter-zipkin</artifactId>
|
|
|
|
|
|
</dependency>
|
|
|
|
|
|
<!--添加 Sleuth 依赖 -->
|
|
|
|
|
|
<dependency>
|
|
|
|
|
|
<groupId>org.springframework.cloud</groupId>
|
|
|
|
|
|
<artifactId>spring-cloud-starter-sleuth</artifactId>
|
|
|
|
|
|
</dependency>
|
|
|
|
|
|
</dependencies>
|
|
|
|
|
|
|
|
|
|
|
|
```
|
|
|
|
|
|
|
|
|
|
|
|
* mall-auth
|
|
|
|
|
|
|
|
|
|
|
|
mall-auth 是认证中心服务,主要结合 Oauth2 实现用 JWT 令牌存储信息、刷新令牌功能还有权限认证等工作,涉及的组件主要为 Redis (非 Jedis 客户端方式)和 MySQL。
|
|
|
|
|
|
|
|
|
|
|
|
所以在 pom.xml 文件,引入相关依赖即可。
|
|
|
|
|
|
|
|
|
|
|
|
```java
|
|
|
|
|
|
<!--添加 Sleuth 依赖 -->
|
|
|
|
|
|
<dependency>
|
|
|
|
|
|
<groupId>org.springframework.cloud</groupId>
|
|
|
|
|
|
<artifactId>spring-cloud-starter-sleuth</artifactId>
|
|
|
|
|
|
</dependency>
|
|
|
|
|
|
<!--Zipkin 客户端-->
|
|
|
|
|
|
<dependency>
|
|
|
|
|
|
<groupId>org.springframework.cloud</groupId>
|
|
|
|
|
|
<artifactId>spring-cloud-starter-zipkin</artifactId>
|
|
|
|
|
|
</dependency>
|
|
|
|
|
|
<!-- Brave 对 MySQL8 的支持 -->
|
|
|
|
|
|
<dependency>
|
|
|
|
|
|
<groupId>io.zipkin.brave</groupId>
|
|
|
|
|
|
<artifactId>brave-instrumentation-mysql8</artifactId>
|
|
|
|
|
|
</dependency>
|
|
|
|
|
|
|
|
|
|
|
|
```
|
|
|
|
|
|
|
|
|
|
|
|
启动应用后,我们使用 API 文档测试下接口,尝试跟踪该链路。
|
|
|
|
|
|
|
|
|
|
|
|
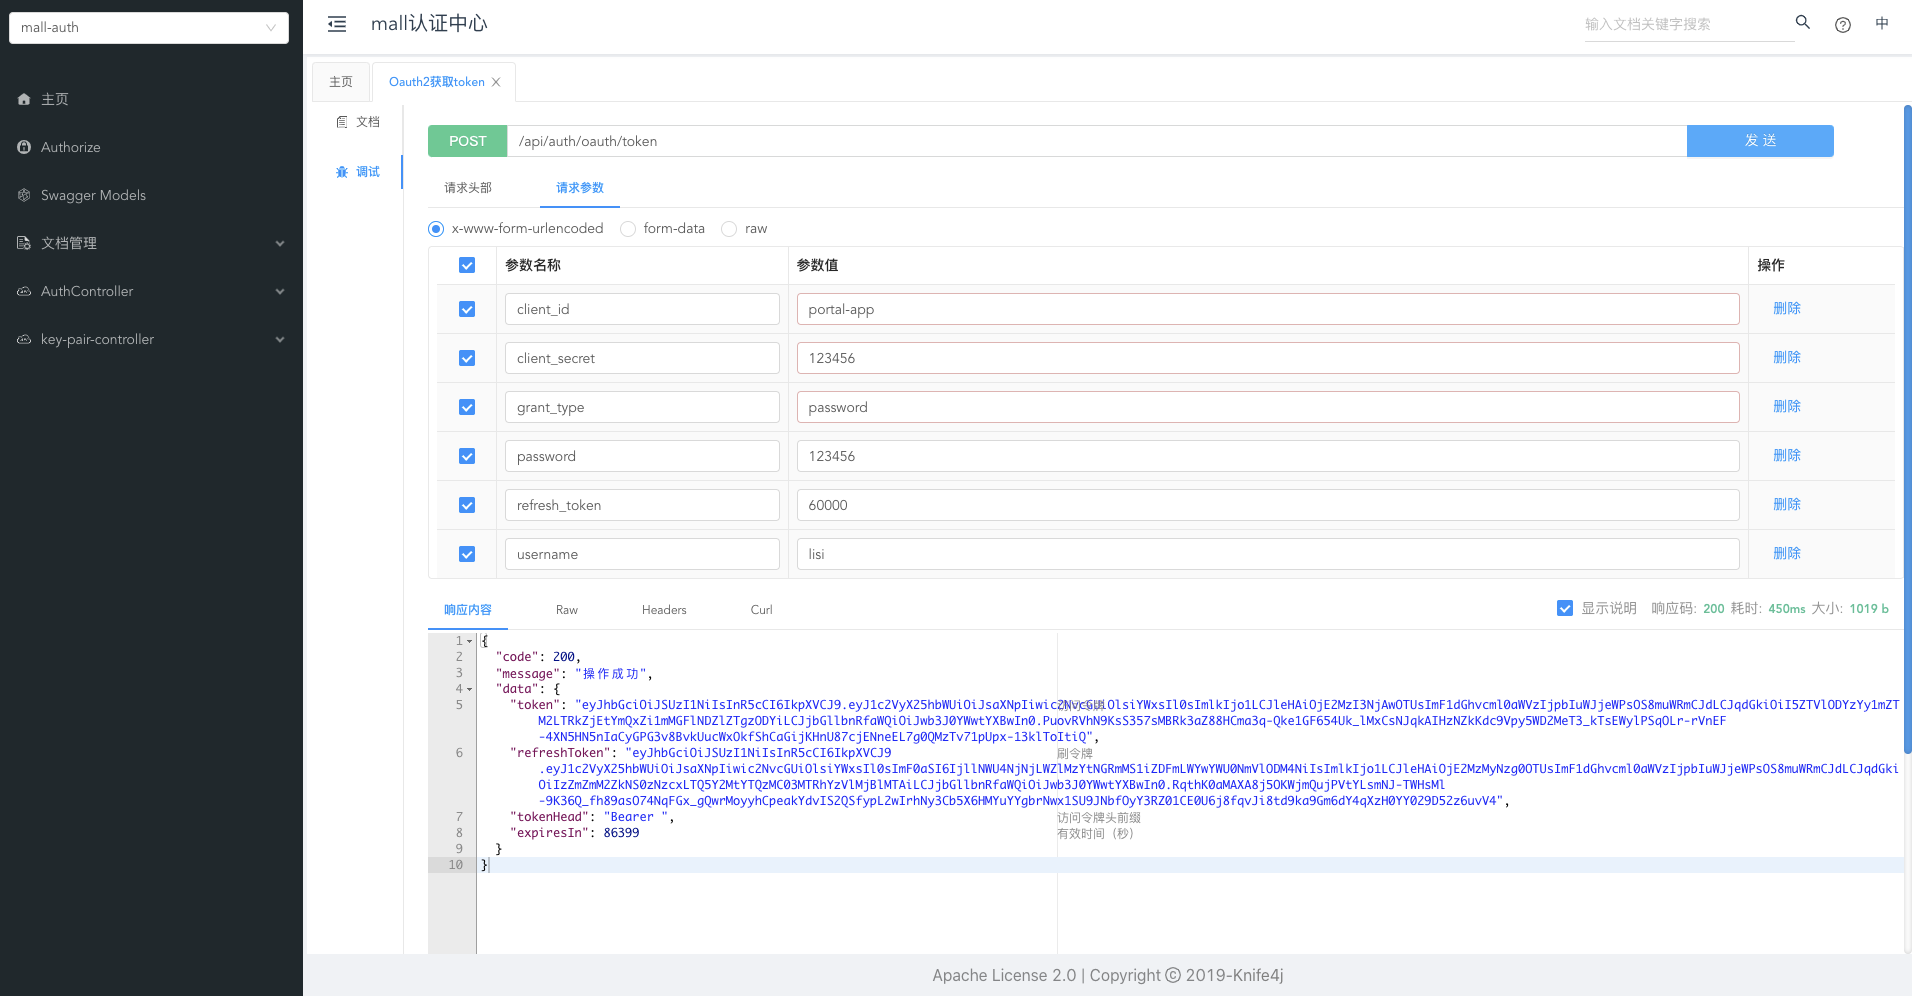
|
|
|
|
|
|
|
|
|
|
|
|
在 Zipkin 就可以看到刚才我们调用接口的链路数据了,它分别涉及了四个组件。
|
|
|
|
|
|
|
|
|
|
|
|
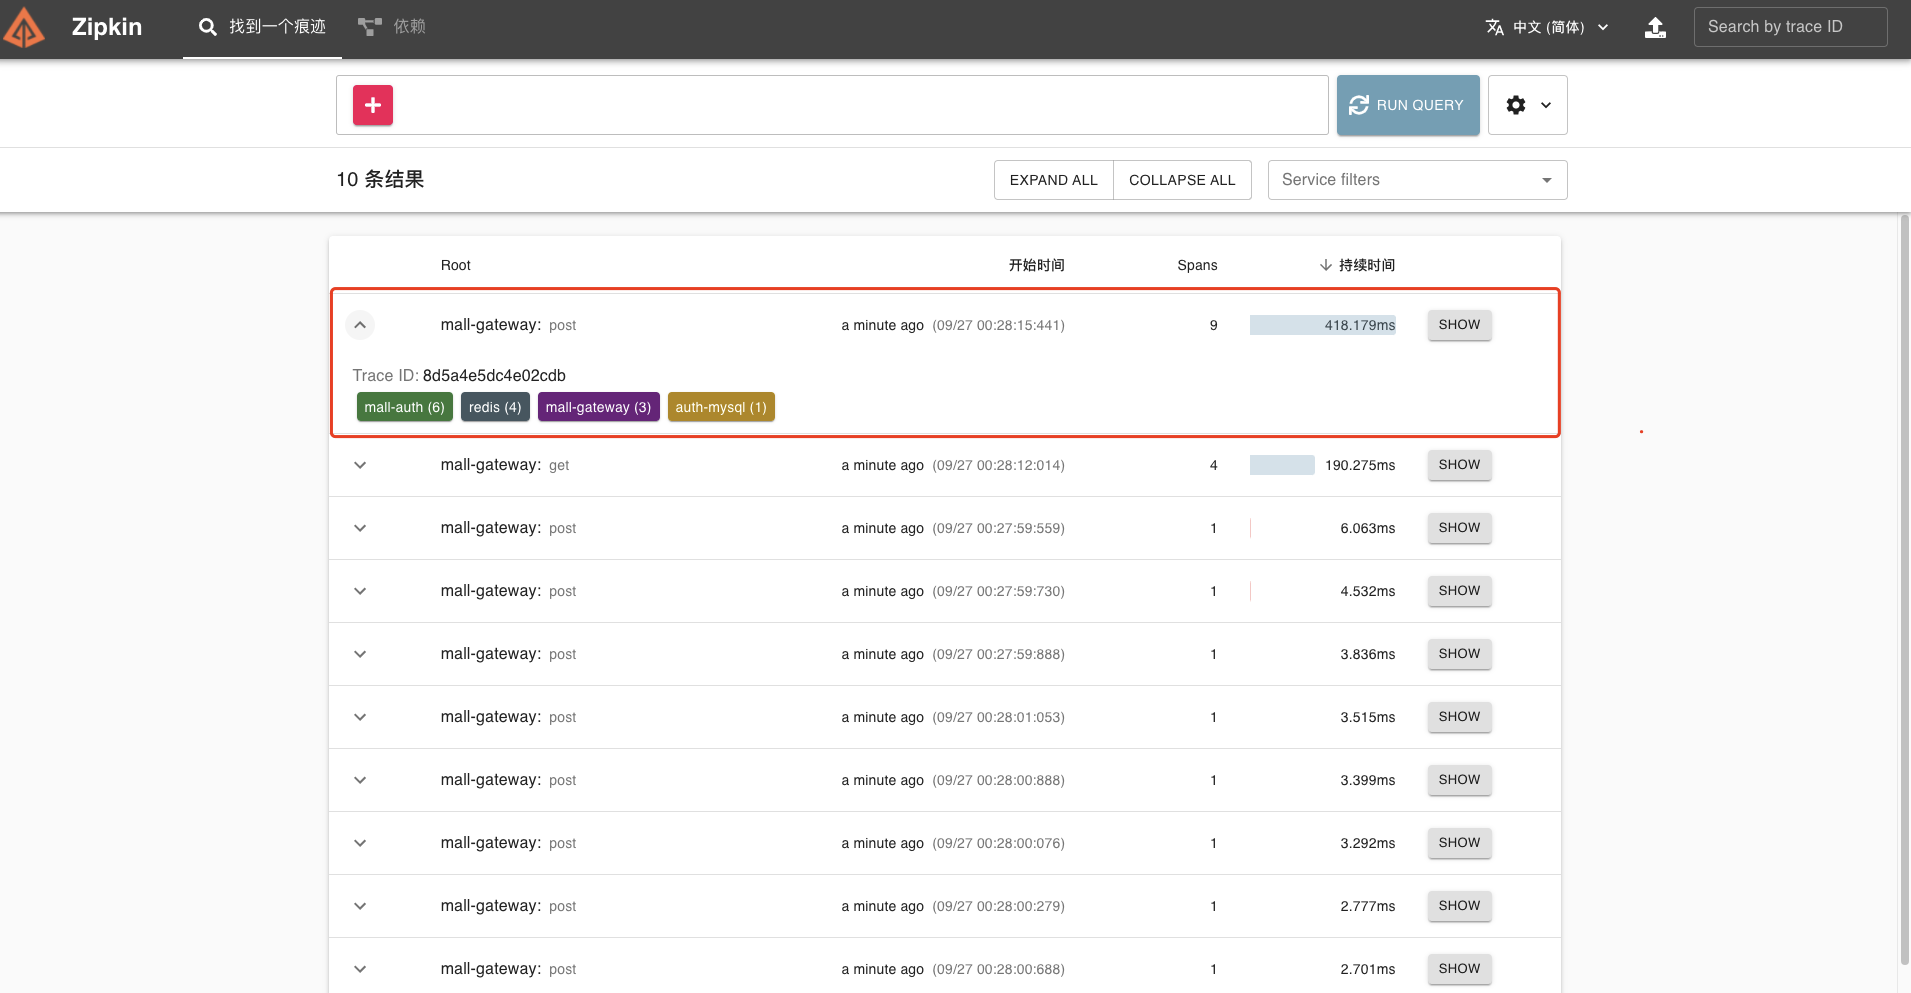
|
|
|
|
|
|
|
|
|
|
|
|
我们点开该链路,可以看到一个 Trace 明细。
|
|
|
|
|
|
|
|
|
|
|
|
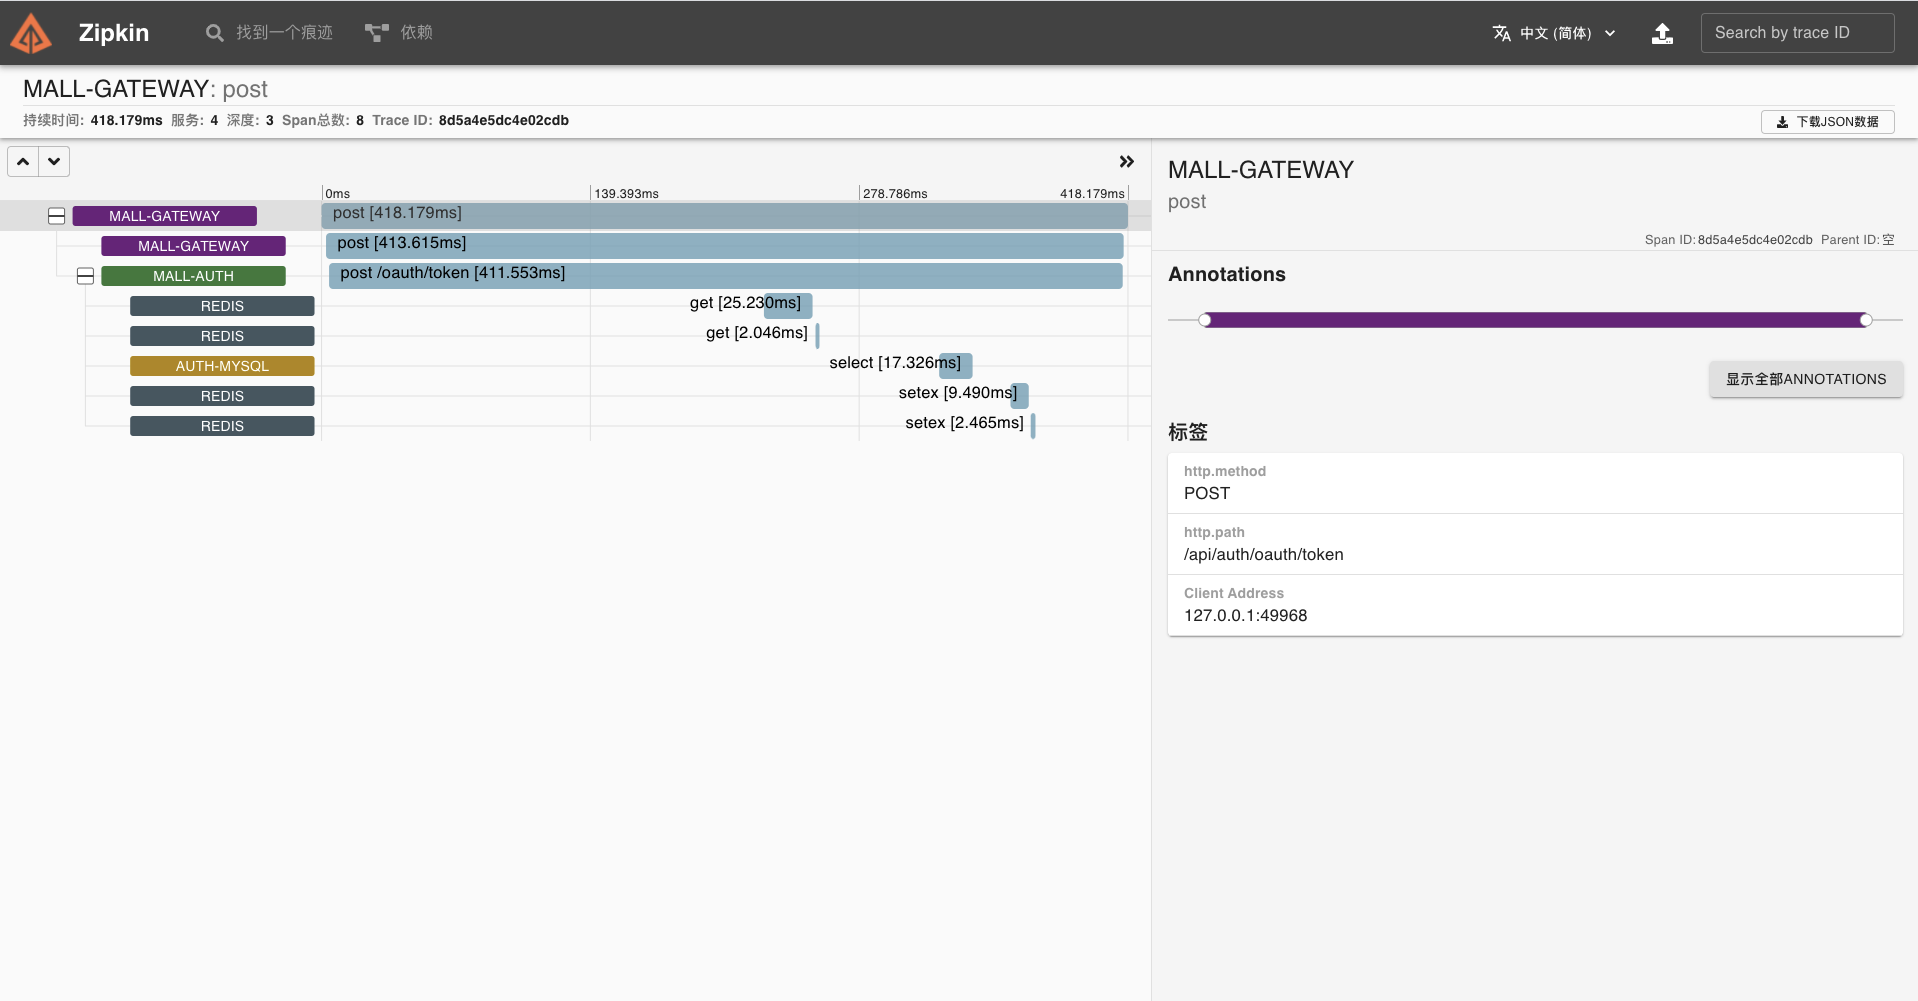
|
|
|
|
|
|
|
|
|
|
|
|
同样,我们也可以查看拓扑关系。
|
|
|
|
|
|
|
|
|
|
|
|
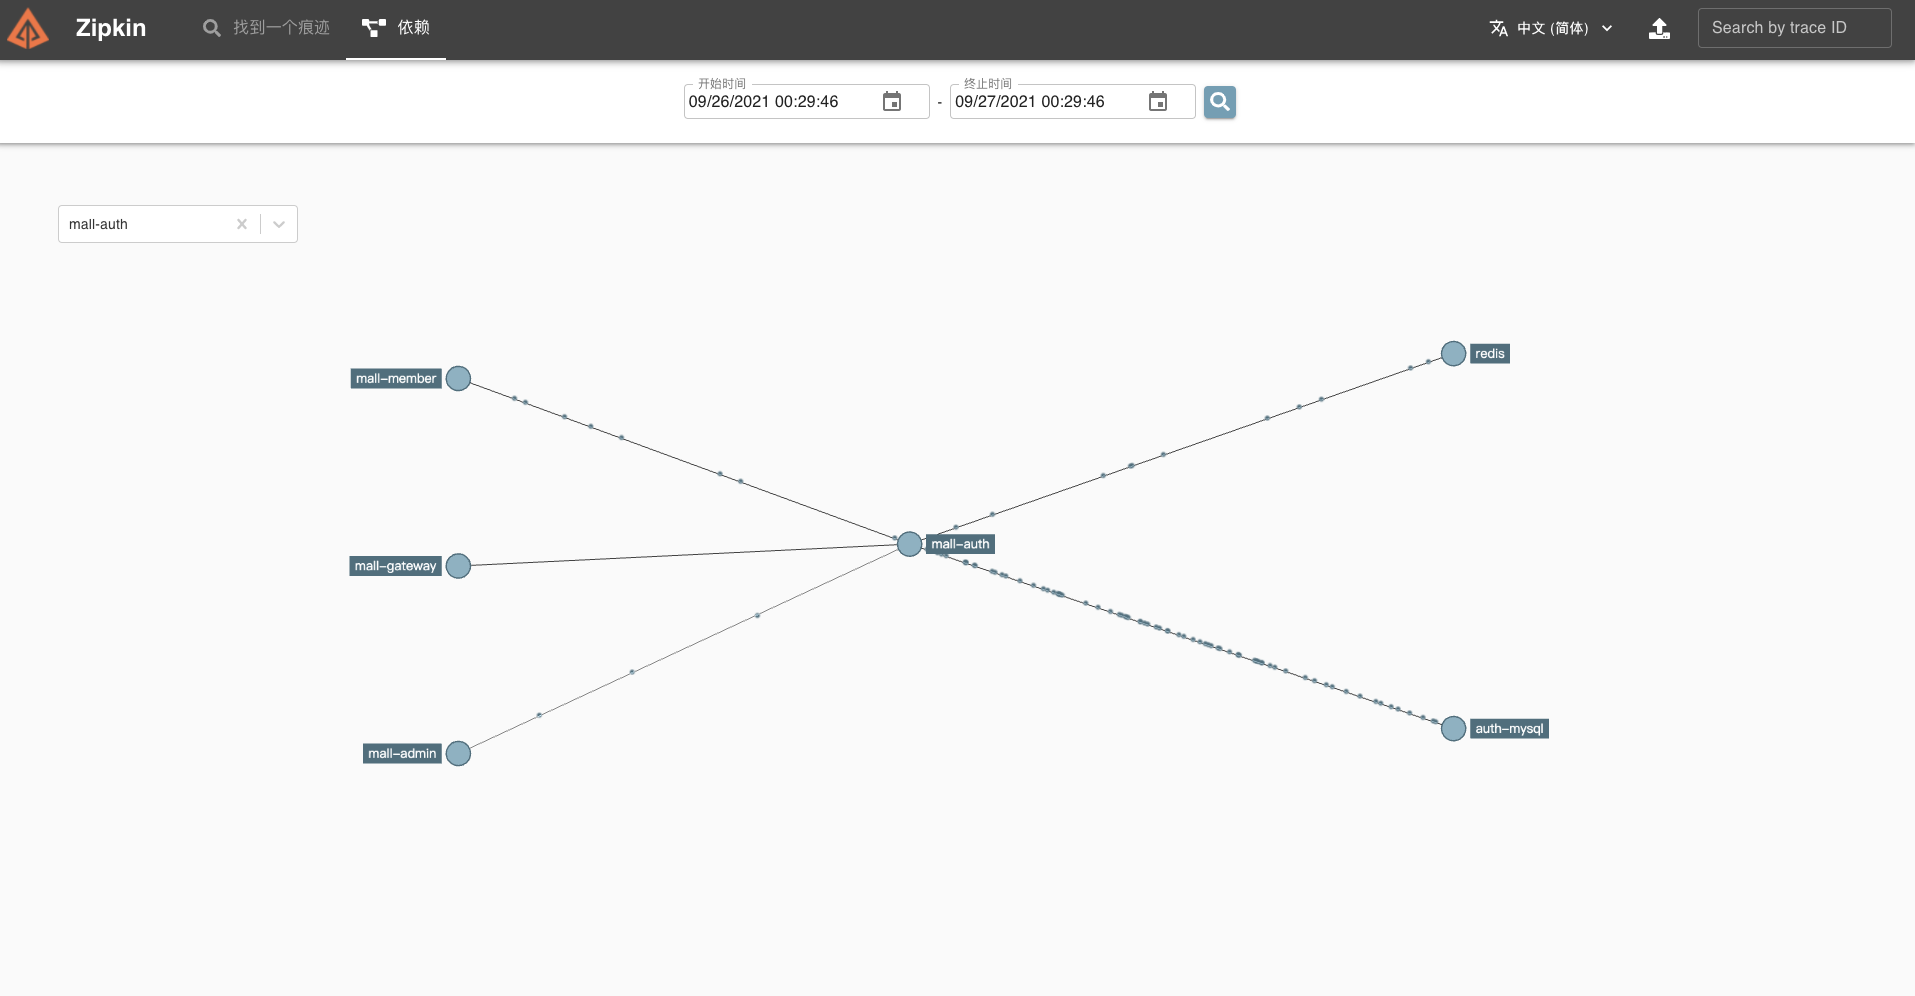
|
|
|
|
|
|
|
|
|
|
|
|
* mall-member
|
|
|
|
|
|
|
|
|
|
|
|
mall-member 是我们的会员服务,这里以核心接口【会员登录】为例,梳理一下它涉及到的组件。
|
|
|
|
|
|
|
|
|
|
|
|
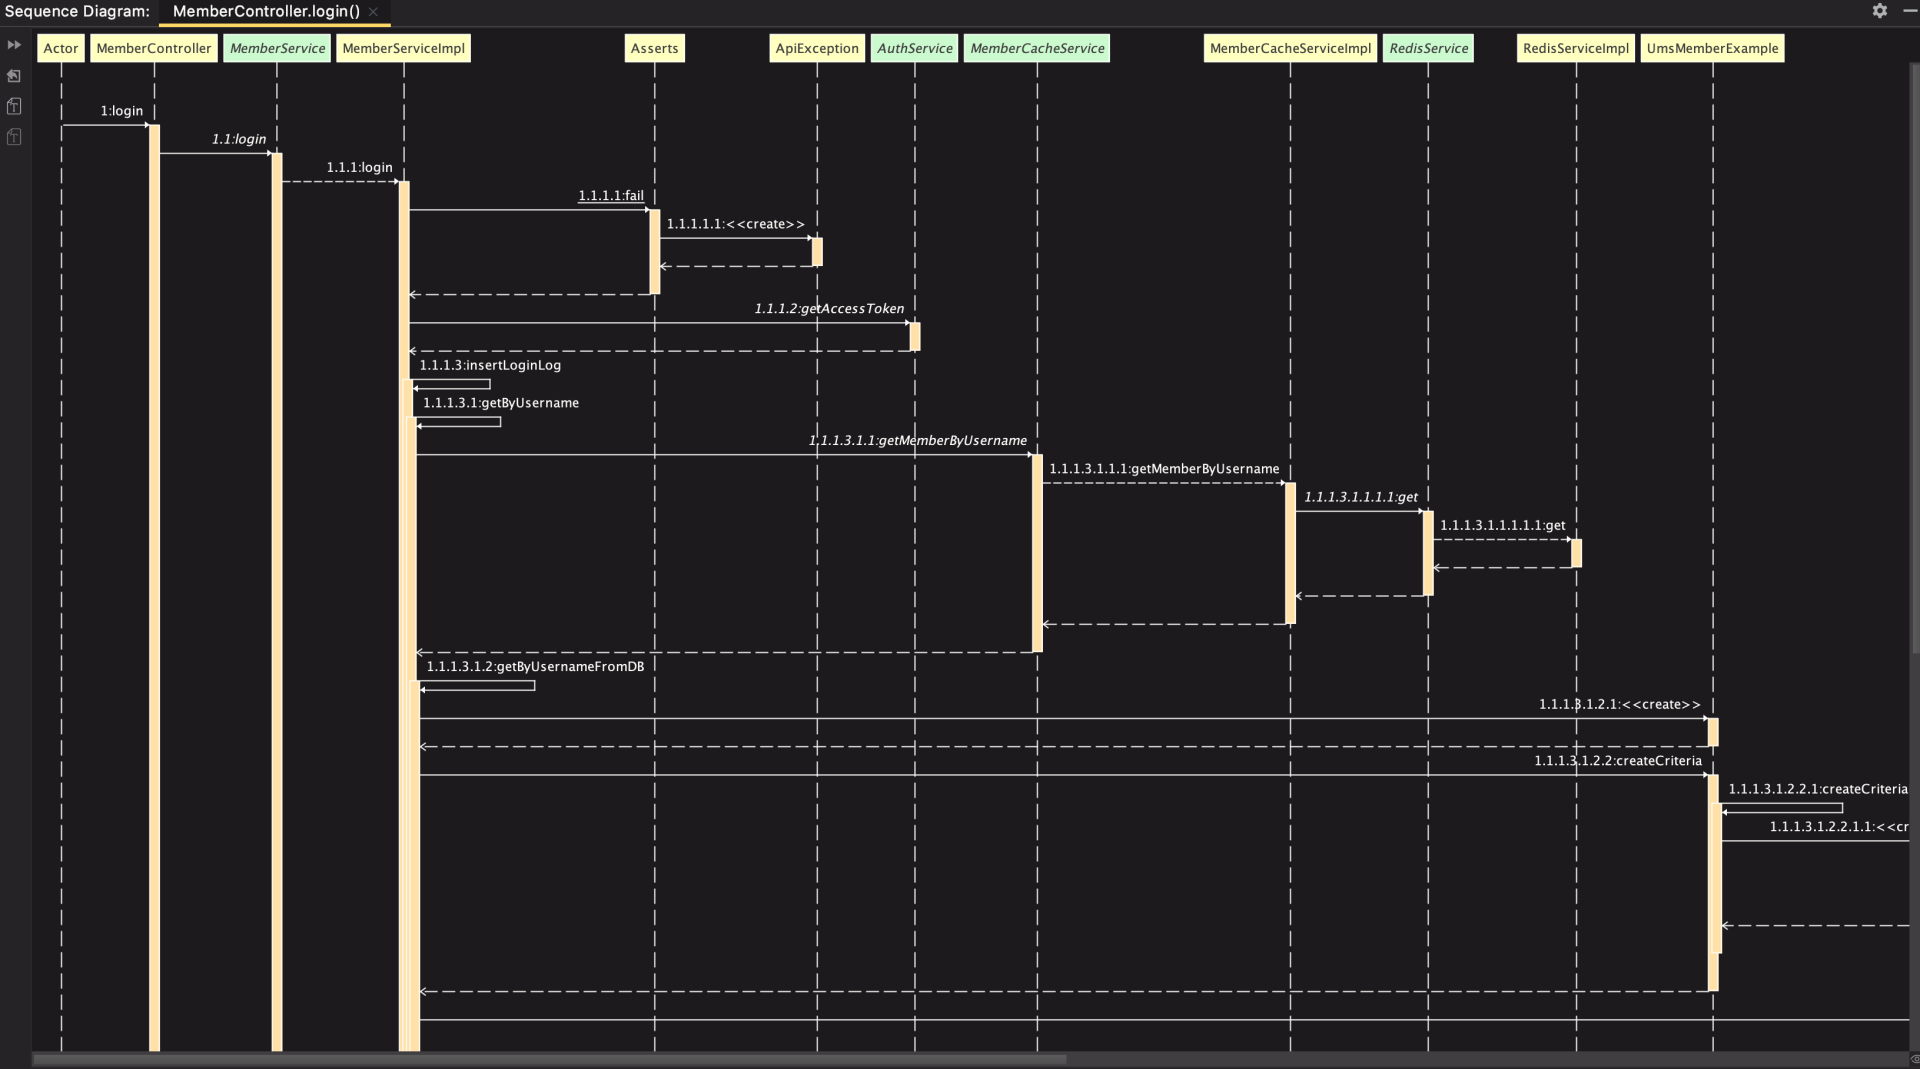
|
|
|
|
|
|
|
|
|
|
|
|
通过分析代码调用链,我们知道它主要涉及 MySQL、Redis、MongoDB 等组件。
|
|
|
|
|
|
|
|
|
|
|
|
所以我们只需要在 pom.xml 文件引入相关依赖即可。
|
|
|
|
|
|
|
|
|
|
|
|
```xml
|
|
|
|
|
|
<!--添加 Sleuth 依赖 -->
|
|
|
|
|
|
<dependency>
|
|
|
|
|
|
<groupId>org.springframework.cloud</groupId>
|
|
|
|
|
|
<artifactId>spring-cloud-starter-sleuth</artifactId>
|
|
|
|
|
|
</dependency>
|
|
|
|
|
|
<!--Zipkin 客户端-->
|
|
|
|
|
|
<dependency>
|
|
|
|
|
|
<groupId>org.springframework.cloud</groupId>
|
|
|
|
|
|
<artifactId>spring-cloud-starter-zipkin</artifactId>
|
|
|
|
|
|
</dependency>
|
|
|
|
|
|
<!-- Brave 对 MySQL8 的支持 -->
|
|
|
|
|
|
<dependency>
|
|
|
|
|
|
<groupId>io.zipkin.brave</groupId>
|
|
|
|
|
|
<artifactId>brave-instrumentation-mysql8</artifactId>
|
|
|
|
|
|
</dependency>
|
|
|
|
|
|
<!--添加 brave mongodb 依赖 -->
|
|
|
|
|
|
<dependency>
|
|
|
|
|
|
<groupId>io.zipkin.brave</groupId>
|
|
|
|
|
|
<artifactId>brave-instrumentation-mongodb</artifactId>
|
|
|
|
|
|
<version>5.13.3</version>
|
|
|
|
|
|
</dependency>
|
|
|
|
|
|
<!-- Brave 对 Opentracing 的实现 -->
|
|
|
|
|
|
<dependency>
|
|
|
|
|
|
<groupId>io.opentracing.brave</groupId>
|
|
|
|
|
|
<artifactId>brave-opentracing</artifactId>
|
|
|
|
|
|
<version>0.35.0</version>
|
|
|
|
|
|
</dependency>
|
|
|
|
|
|
<!-- Opentracing 对 Redis 的支持 -->
|
|
|
|
|
|
<dependency>
|
|
|
|
|
|
<groupId>io.opentracing.contrib</groupId>
|
|
|
|
|
|
<artifactId>opentracing-redis-jedis3</artifactId>
|
|
|
|
|
|
<version>0.1.16</version>
|
|
|
|
|
|
</dependency>
|
|
|
|
|
|
<dependency>
|
|
|
|
|
|
<groupId>io.opentracing.contrib</groupId>
|
|
|
|
|
|
<artifactId>opentracing-redis-spring-data</artifactId>
|
|
|
|
|
|
<version>0.1.16</version>
|
|
|
|
|
|
</dependency>
|
|
|
|
|
|
|
|
|
|
|
|
```
|
|
|
|
|
|
|
|
|
|
|
|
同时,要在 config 下新增两个配置类。
|
|
|
|
|
|
|
|
|
|
|
|
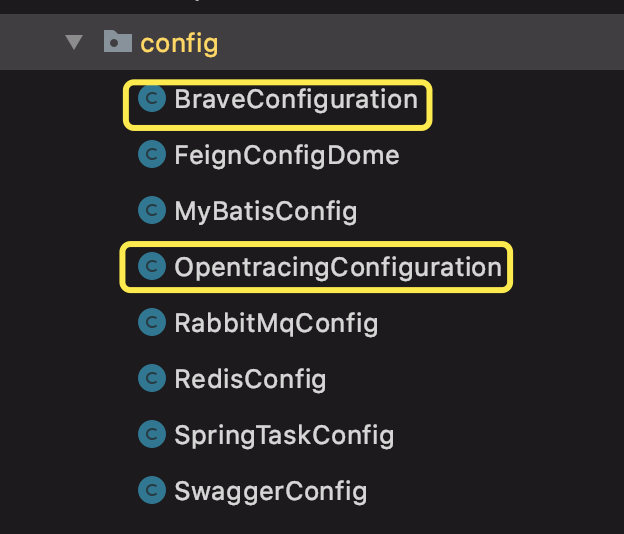
|
|
|
|
|
|
|
|
|
|
|
|
BraveConfiguration 为 MongoDB 链路追踪配置类,OpentracingConfiguration 为 Redis 组件链路追踪配置类。
|
|
|
|
|
|
|
|
|
|
|
|
启动应用后,我们使用 API 文档测试【会员登录】接口,尝试追踪该链路。
|
|
|
|
|
|
|
|
|
|
|
|
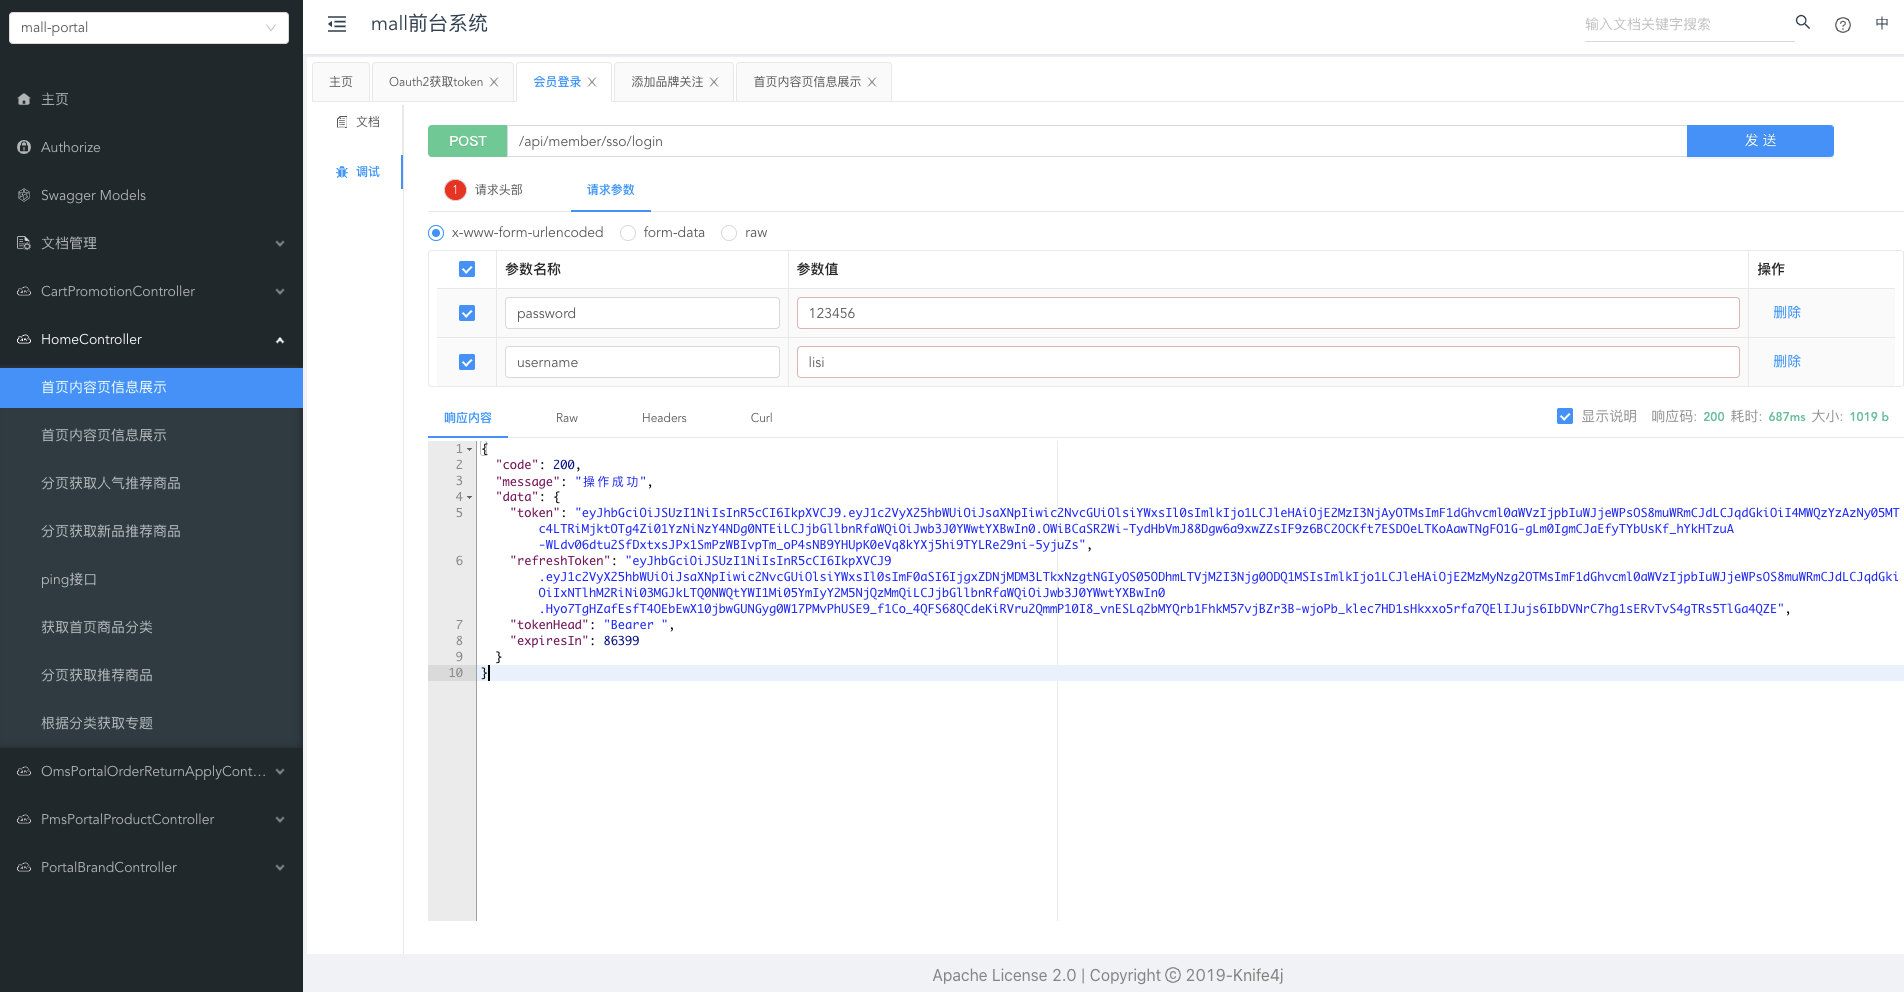
|
|
|
|
|
|
|
|
|
|
|
|
在 Zipkin 中可以看到刚才我们调用接口的链路数据,它分别涉及了五个组件。
|
|
|
|
|
|
|
|
|
|
|
|
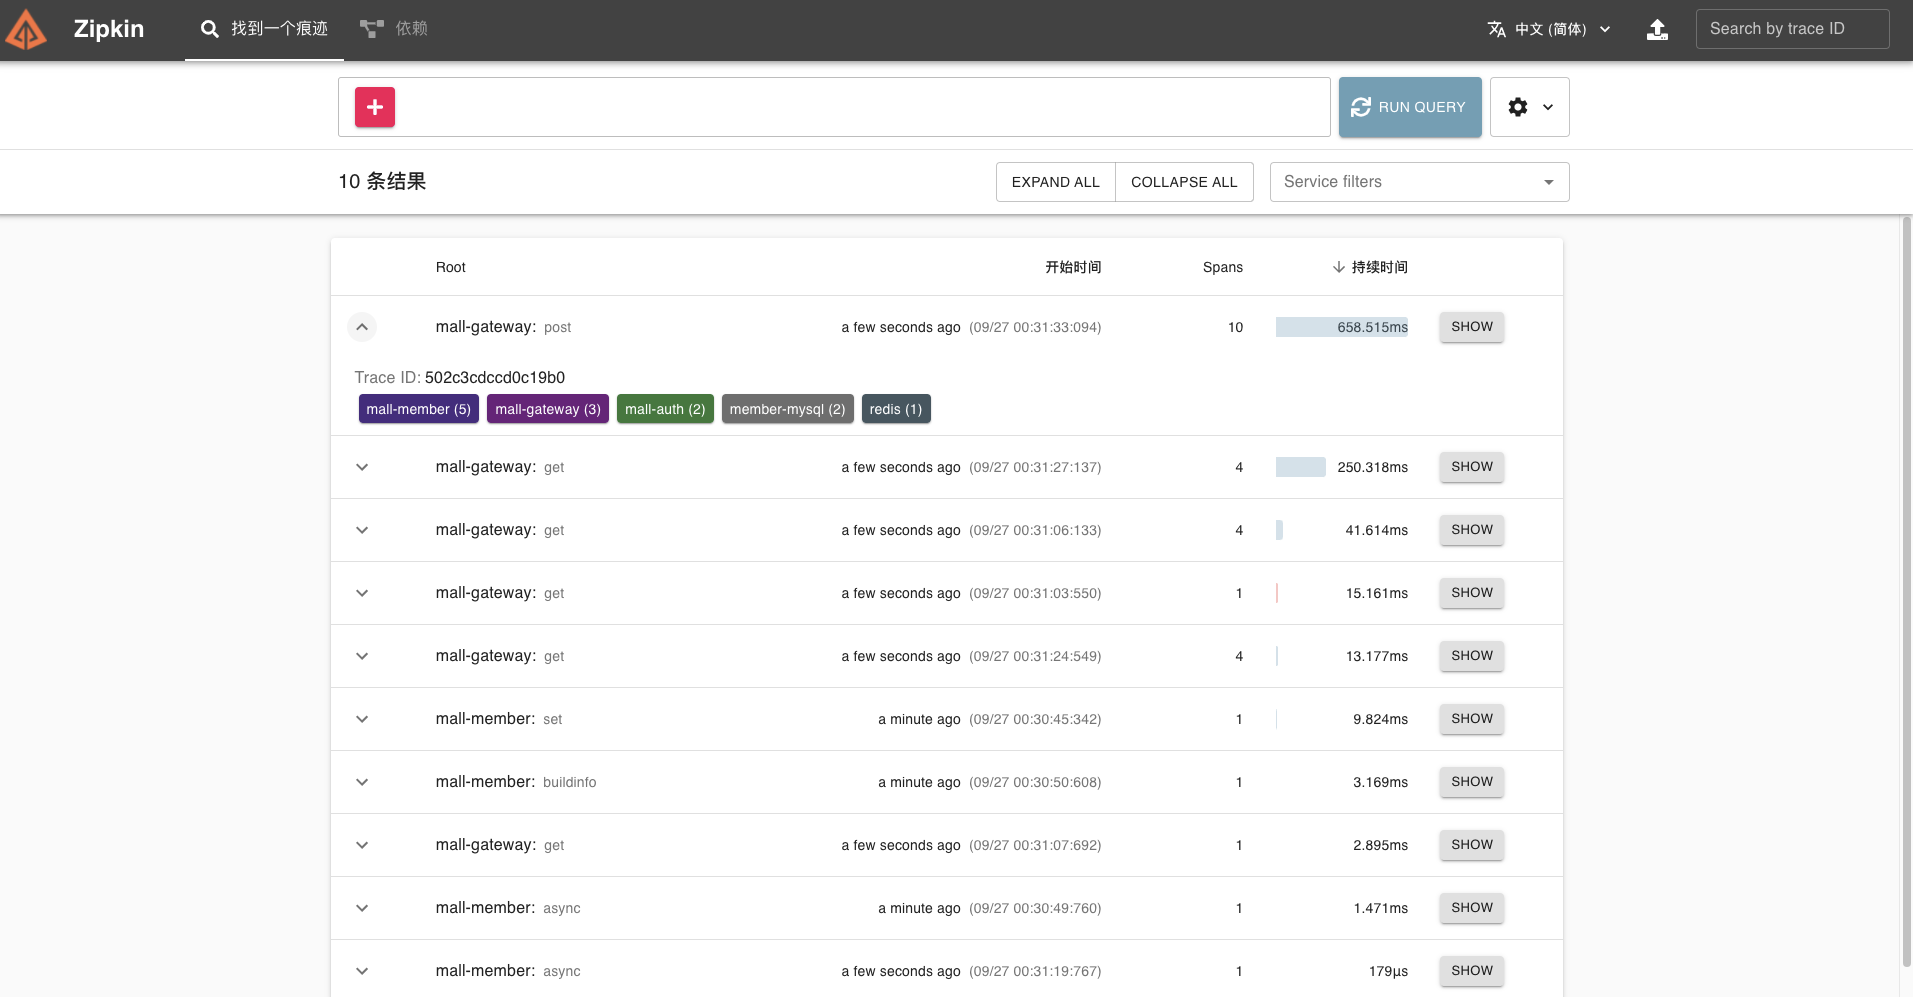
|
|
|
|
|
|
|
|
|
|
|
|
我们点开这条链路,可以看到 Trace 明细。
|
|
|
|
|
|
|
|
|
|
|
|
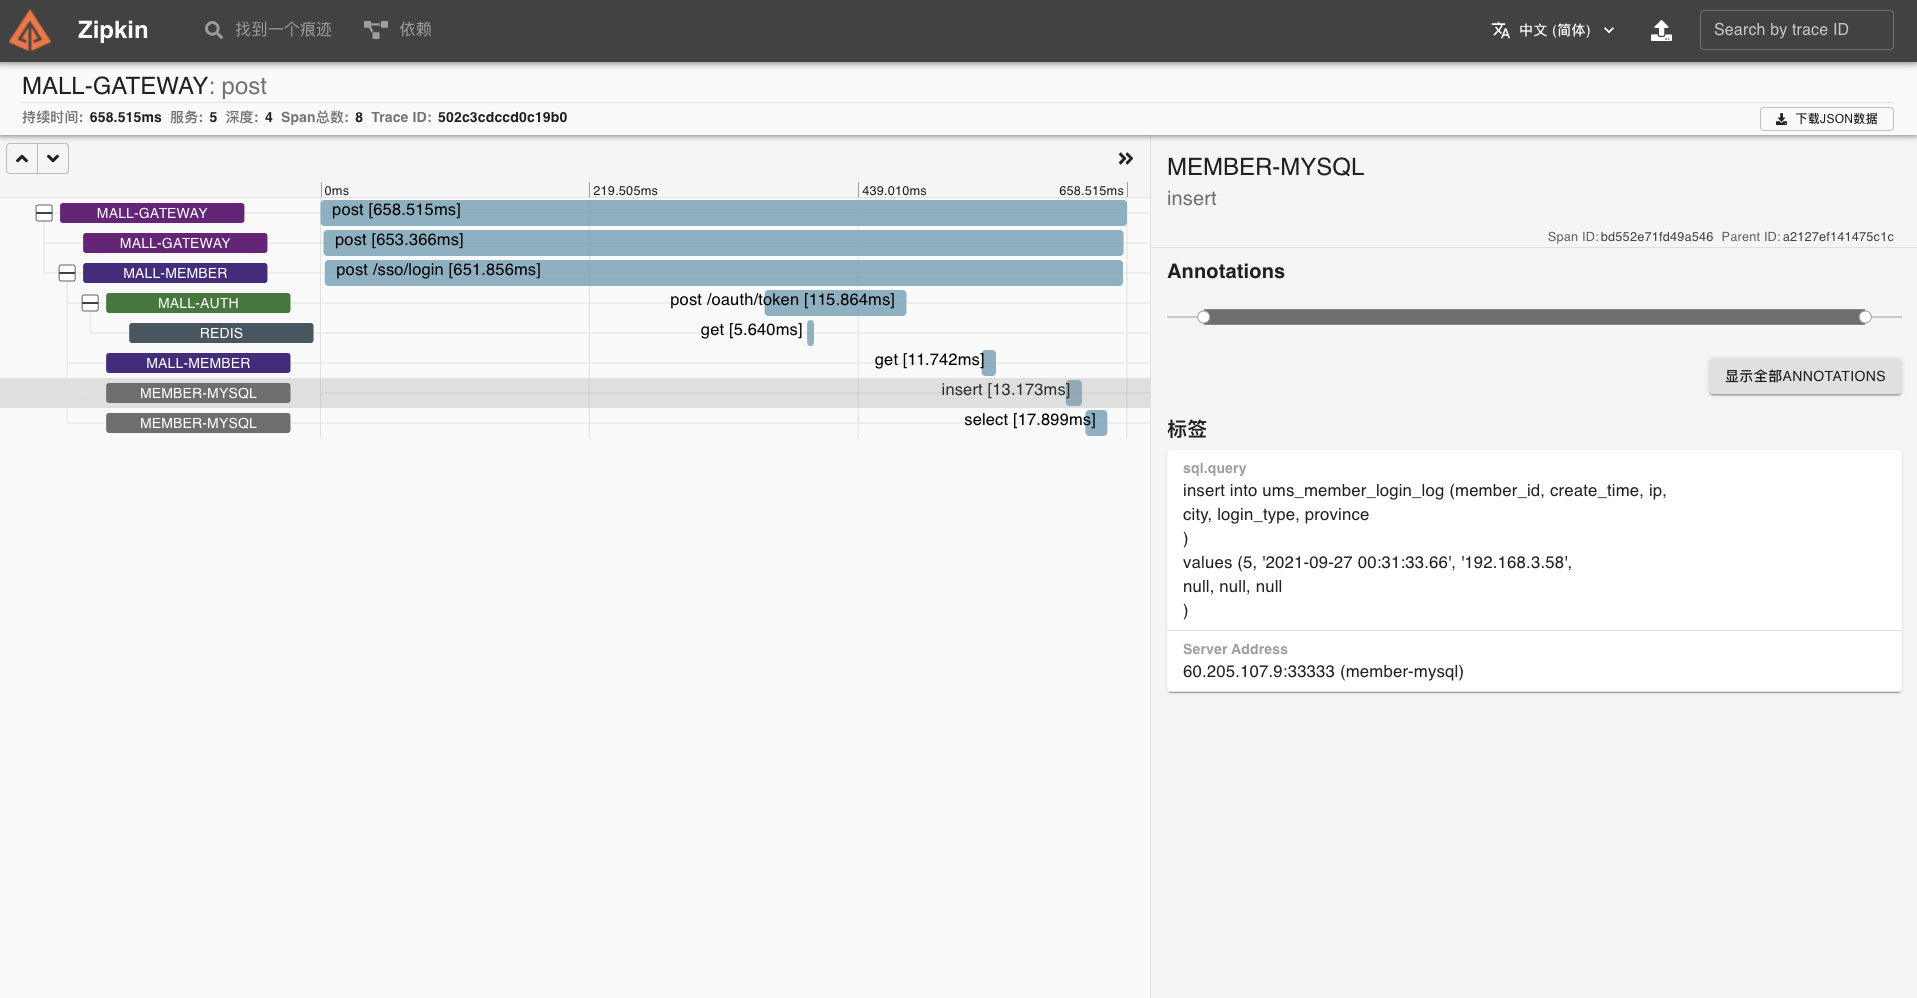
|
|
|
|
|
|
|
|
|
|
|
|
也可以查找依赖,看到拓扑关系。
|
|
|
|
|
|
|
|
|
|
|
|
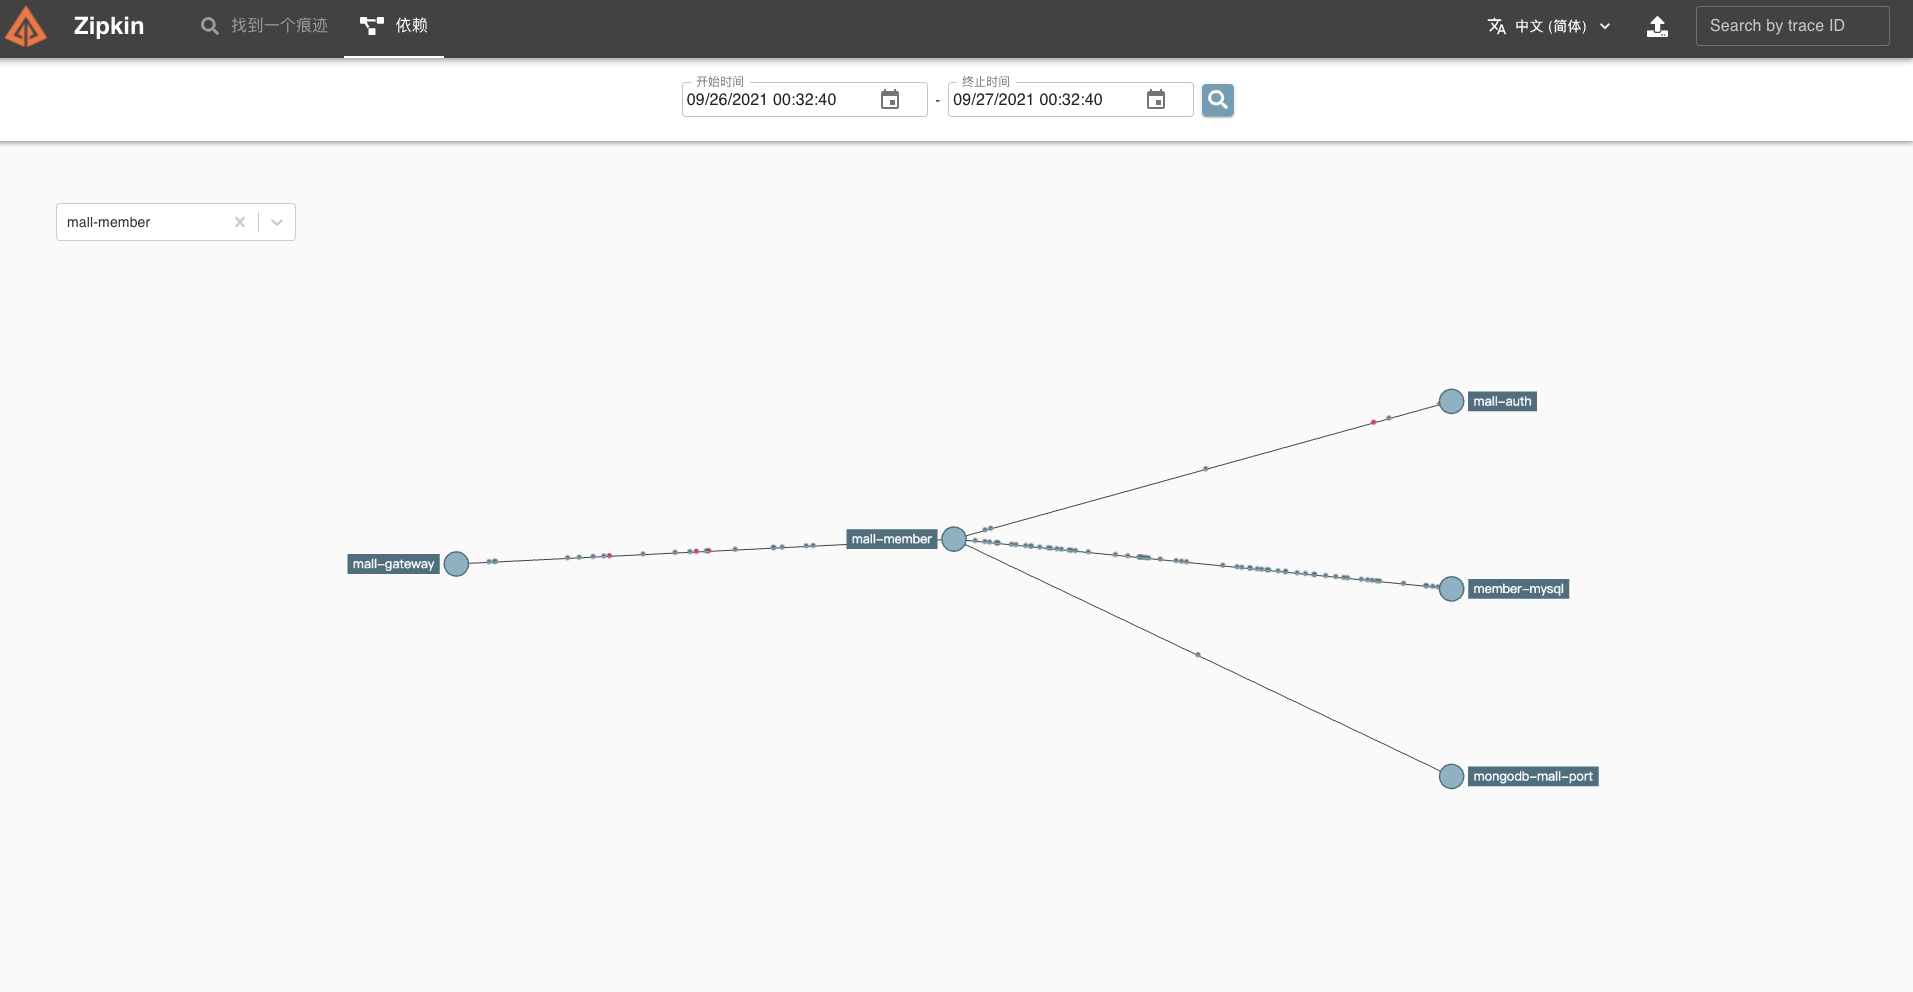
|
|
|
|
|
|
|
|
|
|
|
|
接着我们使用 API 文档测试一下【添加品牌关注】接口,尝试追踪该链路。
|
|
|
|
|
|
|
|
|
|
|
|
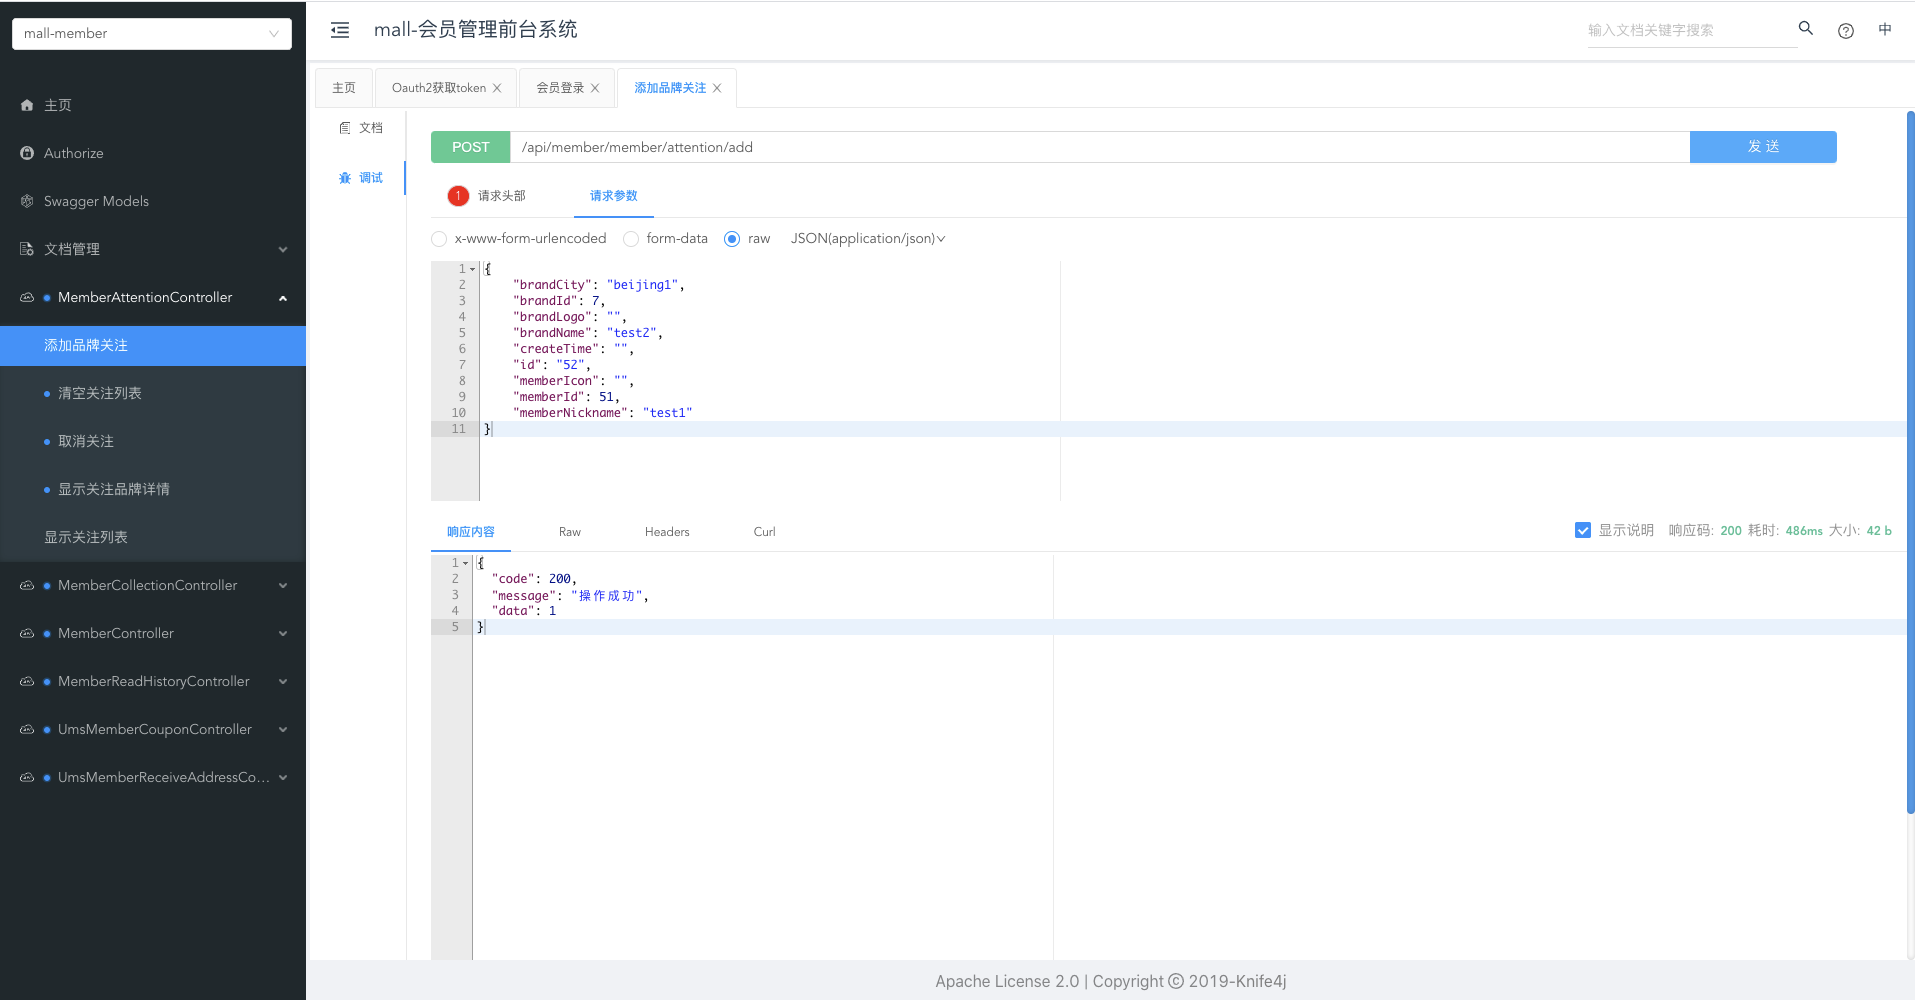
|
|
|
|
|
|
|
|
|
|
|
|
在 Zipkin 可以看到刚才我们调用接口的链路数据,它分别涉及了三个组件。
|
|
|
|
|
|
|
|
|
|
|
|
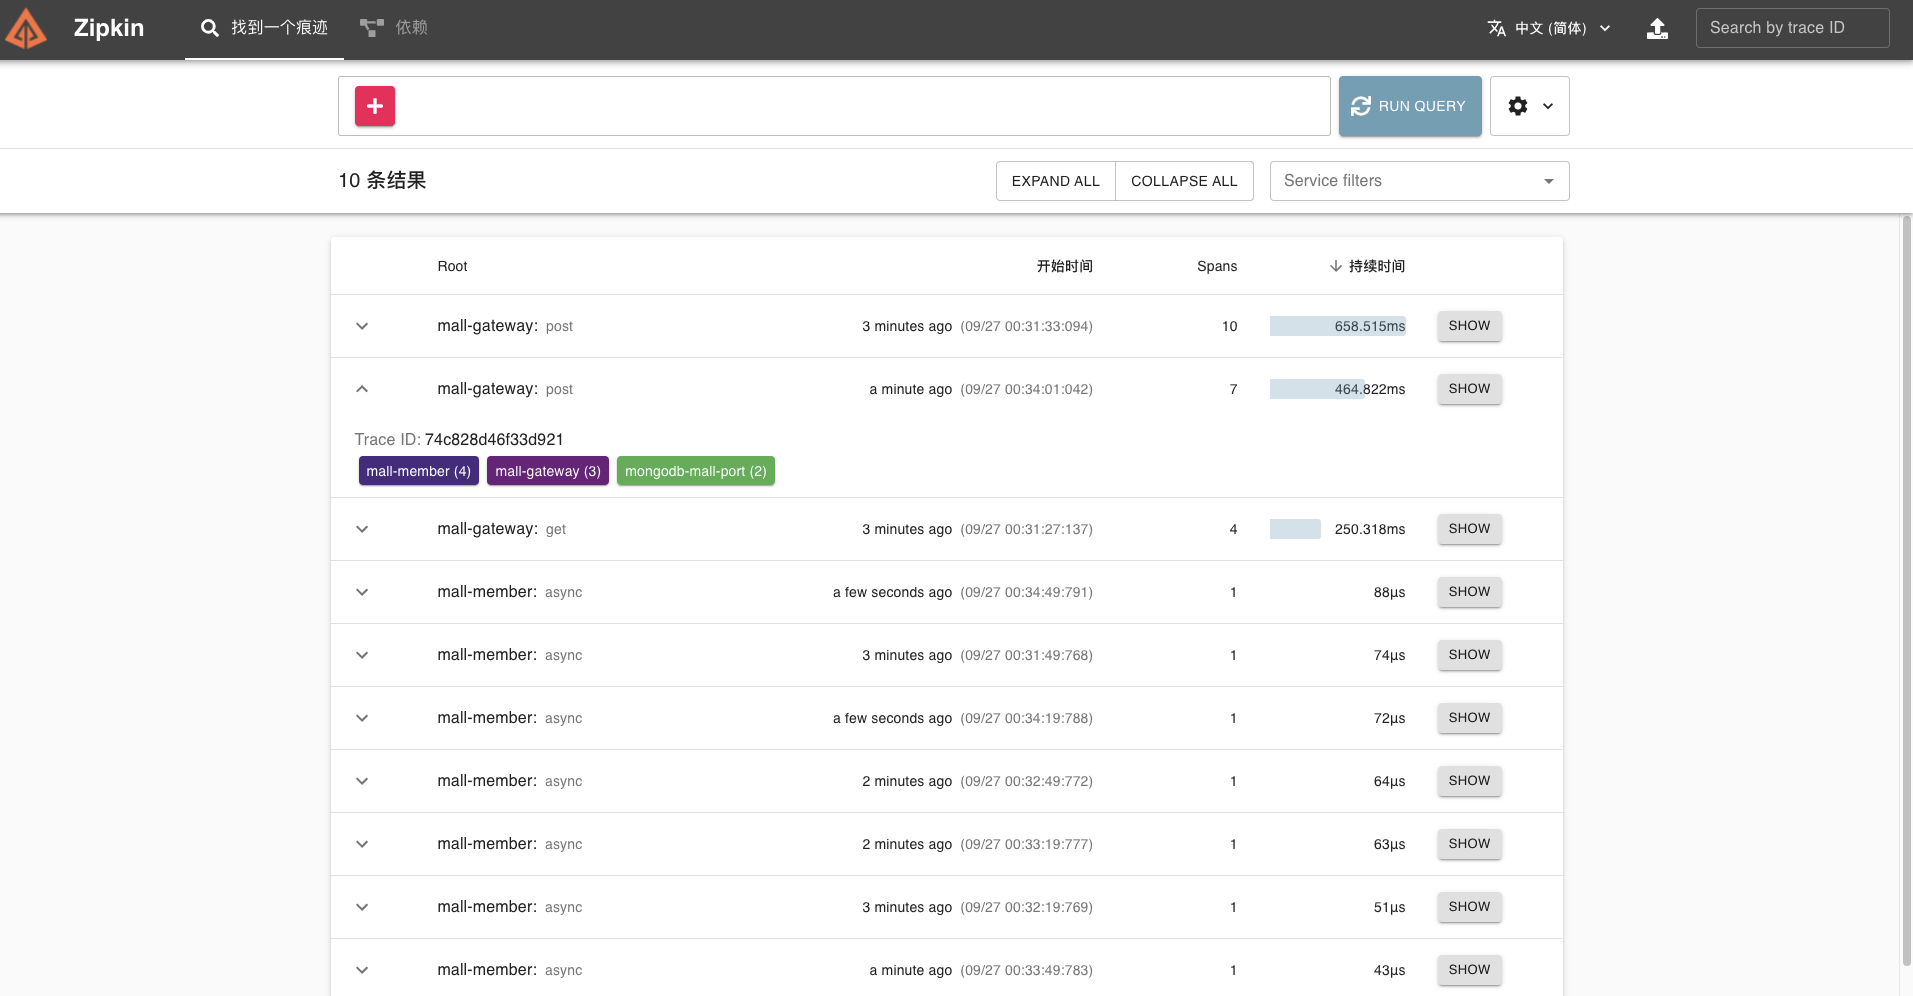
|
|
|
|
|
|
|
|
|
|
|
|
我们点开这条链路,也可以看到详细的 Trace 明细。
|
|
|
|
|
|
|
|
|
|
|
|
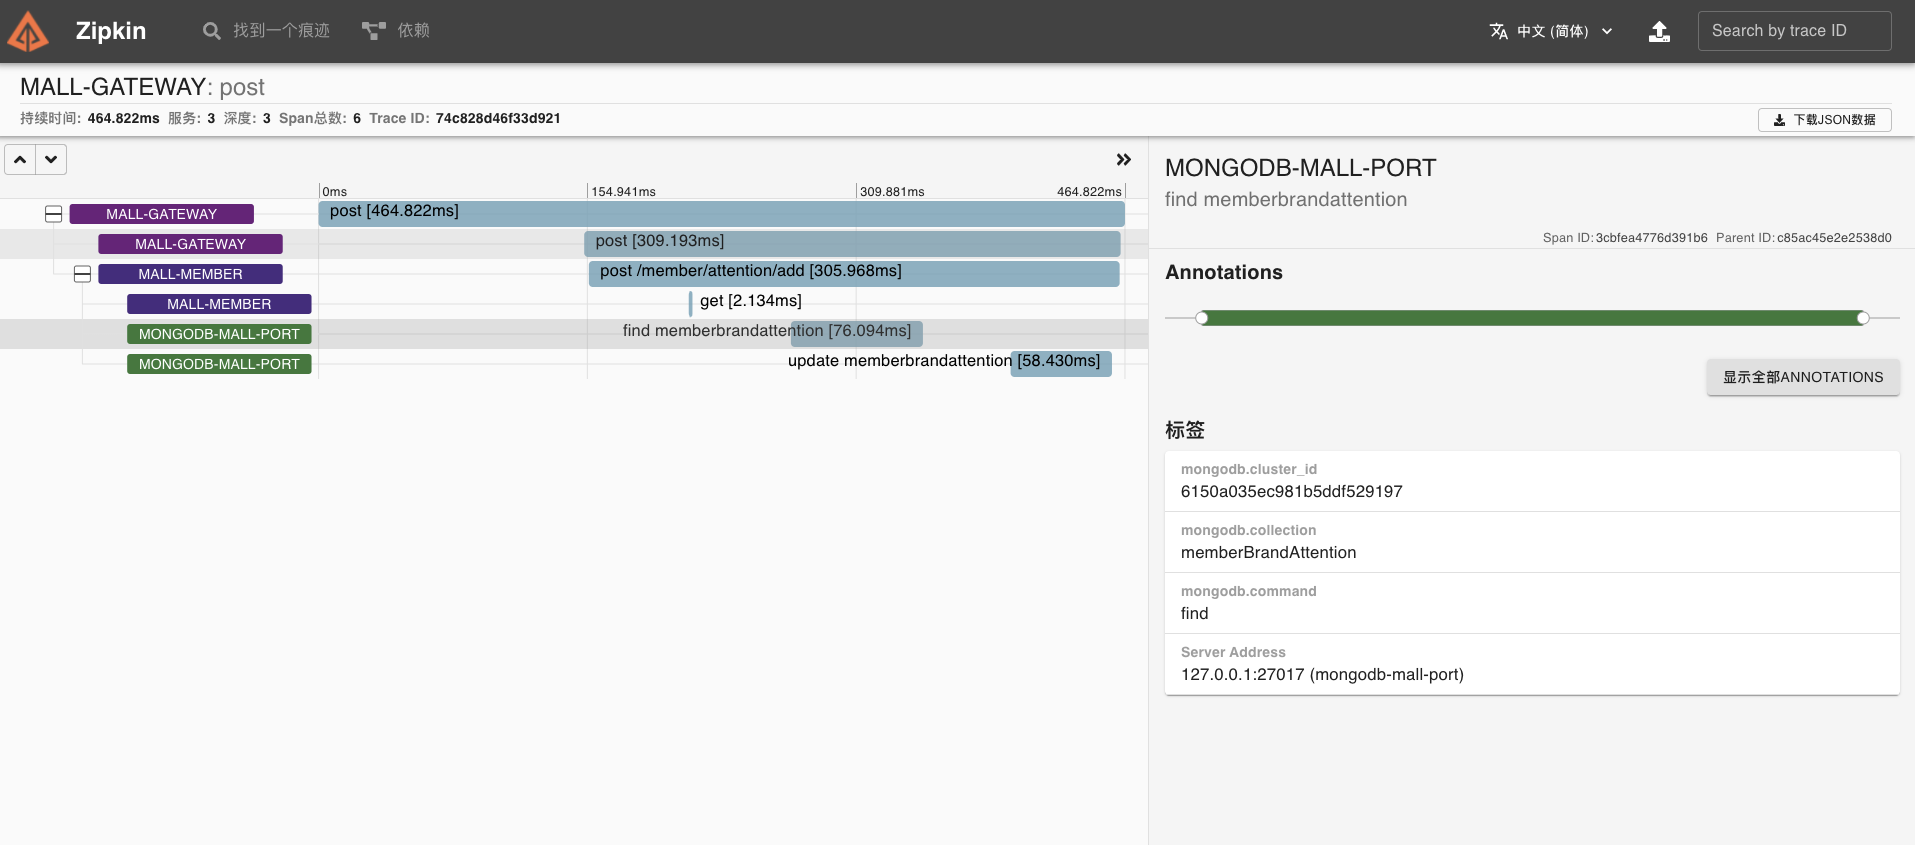
|
|
|
|
|
|
|
|
|
|
|
|
### Zipkin 改造
|
|
|
|
|
|
|
|
|
|
|
|
改造完服务后,我们还有一个需求,那就是对 Zipkin 生产环境的功能增强。也就是说, 我们这里将链路日志推送到 Kafka,然后启动 Zipkin Server 聚合日志,监听 Kafka ,如果有新的消息则进行拉取存入到 ElasticSeach,最后再用 Zipkin UI 展示链路过程。
|
|
|
|
|
|
|
|
|
|
|
|
这里的改造大概分为两个部分:
|
|
|
|
|
|
|
|
|
|
|
|
* 将链路日志数据写入 Kafka 进行削峰;
|
|
|
|
|
|
* Kafka 写入 Zipkin Server 进行聚合并存储。
|
|
|
|
|
|
|
|
|
|
|
|
第一步,我们需要在各个服务引入 Kafka 依赖。
|
|
|
|
|
|
|
|
|
|
|
|
```xml
|
|
|
|
|
|
<!-- 引入 Spring Cloud Stream Kafka-->
|
|
|
|
|
|
<dependency>
|
|
|
|
|
|
<groupId>org.springframework.cloud</groupId>
|
|
|
|
|
|
<artifactId>spring-cloud-starter-stream-kafka</artifactId>
|
|
|
|
|
|
</dependency>
|
|
|
|
|
|
|
|
|
|
|
|
```
|
|
|
|
|
|
|
|
|
|
|
|
第二步,修改 bootstrap.yml 配置文件,增加 Kafka 系列配置。
|
|
|
|
|
|
|
|
|
|
|
|
```yaml
|
|
|
|
|
|
spring:
|
|
|
|
|
|
zipkin: #设置zipkin服务端地址
|
|
|
|
|
|
sender:
|
|
|
|
|
|
type: kafka #指定发送到kafka,还可以指定Rabbit、Web
|
|
|
|
|
|
service:
|
|
|
|
|
|
name: ${spring.application.name} #Zipkin链路日志中收集的服务名称
|
|
|
|
|
|
kafka:
|
|
|
|
|
|
topic: zipkin
|
|
|
|
|
|
kafka:
|
|
|
|
|
|
bootstrap-servers: kafka:9092 #Kubernetes中Kakfa地址,当然也可以指定Kubernetes集群外的Kafk
|
|
|
|
|
|
|
|
|
|
|
|
```
|
|
|
|
|
|
|
|
|
|
|
|
第三步,Zipkin 安装时增加 Storage 参数,比如 Docker 安装可以参考我给出的命令。
|
|
|
|
|
|
|
|
|
|
|
|
```bash
|
|
|
|
|
|
docker run -it -d --restart=always -e KAFKA_BOOTSTRAP_SERVERS=192.168.3.58:9092 -e STORAGE_TYPE=elasticsearch -e ES_HOSTS=http://192.168.3.58:9200 -p 9411:9411 openzipkin/zipkin
|
|
|
|
|
|
|
|
|
|
|
|
```
|
|
|
|
|
|
|
|
|
|
|
|
第四步,在 Kafka Manager 验证一下 Topic 情况。
|
|
|
|
|
|
|
|
|
|
|
|
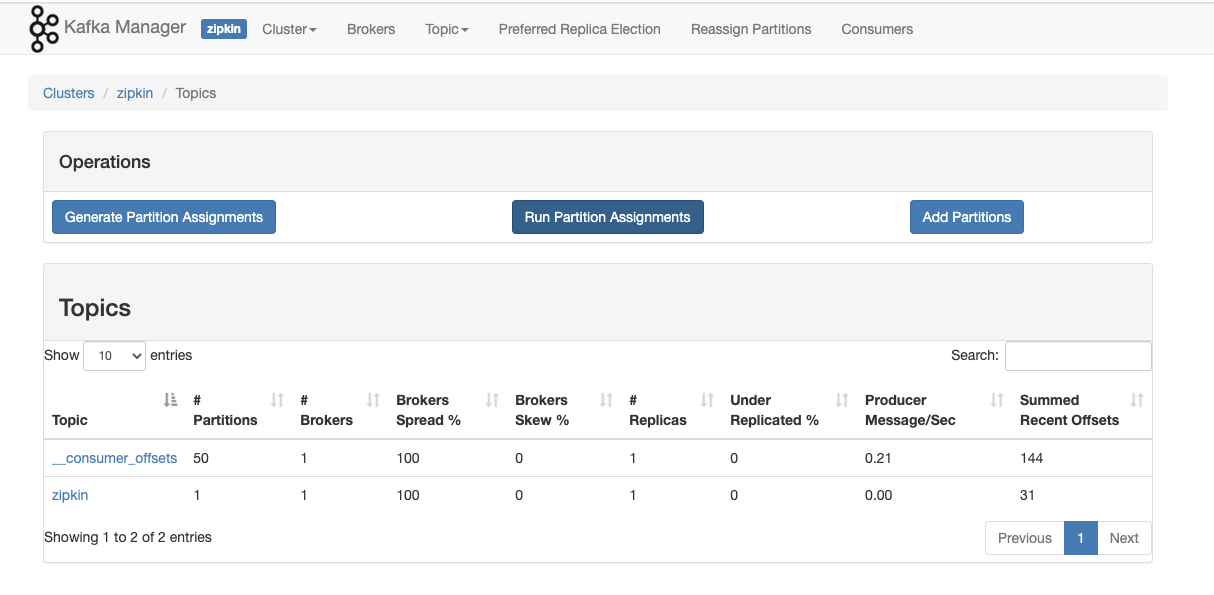
|
|
|
|
|
|
|
|
|
|
|
|
最后,我们使用 ES Head 客户端插件查询一下链路日志。
|
|
|
|
|
|
|
|
|
|
|
|
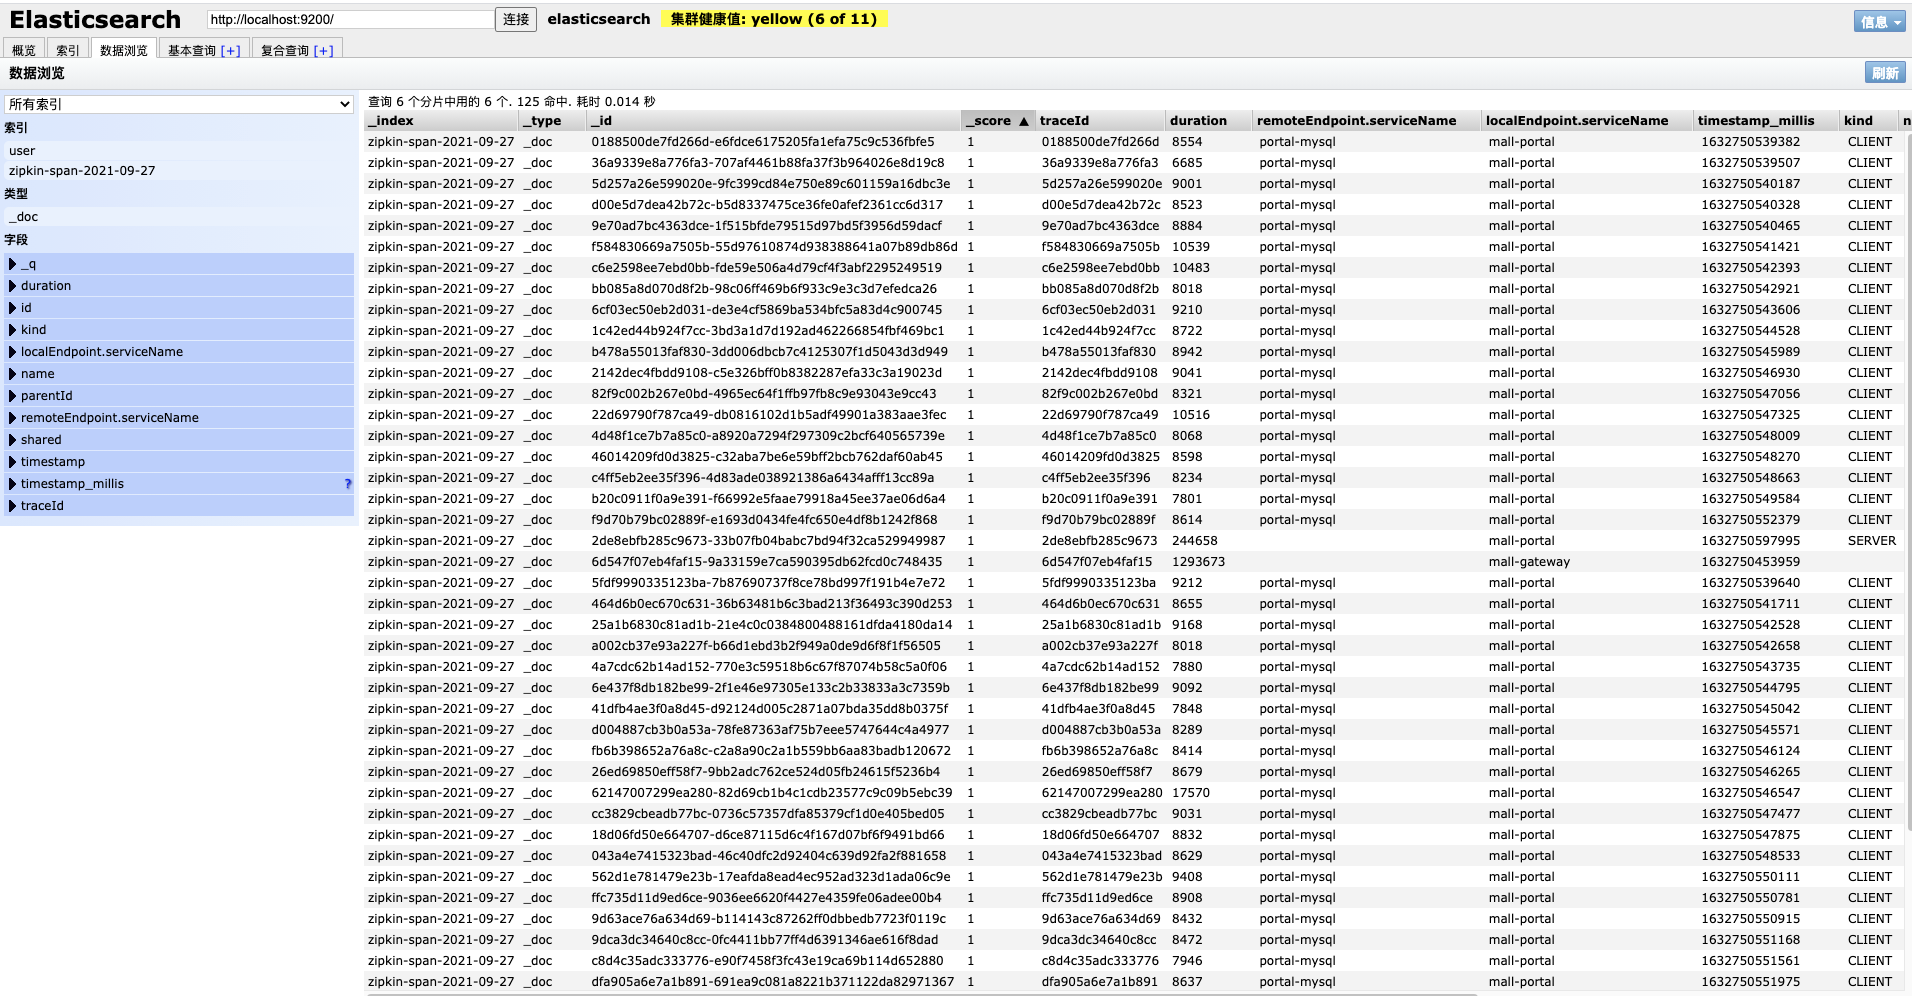
|
|
|
|
|
|
|
|
|
|
|
|
可以看到,链路追踪数据已经成功保存了。
|
|
|
|
|
|
|
|
|
|
|
|
## 总结
|
|
|
|
|
|
|
|
|
|
|
|
好了,这节课的内容到这里就全部讲完了。
|
|
|
|
|
|
|
|
|
|
|
|
刚才,我们进行了 demo 预演和系统实战,演示了如何在微服务项目中集成 Sleuth + Zipkin 落地链路追踪,希望能够给你一些启发。
|
|
|
|
|
|
|
|
|
|
|
|
这里有几个重点我们再一起回顾一下:
|
|
|
|
|
|
|
|
|
|
|
|
* 在 [Brave](https://github.com/openzipkin/brave) 库,常见的 Spring Cloud Gateway、SpringMVC、Fegin、Logback、MongoDB、MySQL、RabbitMQ 等组件均已默认支持;
|
|
|
|
|
|
* 目前 Brave 支持通过三种插件实现 MySQL 链路追踪,具体需要适配 MySQL 驱动版本;
|
|
|
|
|
|
* 目前 Brave 暂未支持 Jedis 客户端的方式,所以我们可以考虑替代用 OpenTracing 的方式;
|
|
|
|
|
|
* 从经验性角度,前置 kafka,一方面作为队列和缓冲,另一方面提供了统一的入口渠道,通过将链路日志数据写入 Kafka 进行削峰,再由 Kafka 写入 Zipkin Server 进行聚合,所以较适合数据量大、服务多的环境。
|
|
|
|
|
|
|
|
|
|
|
|
链路追踪现如今已成为微服务架构性能监控的标配,如何去选型并结合系统本身的特点做到成功的改造是不容易的。希望你可以动手实践起来,因为只有实践才是检验真理的唯一标准。
|
|
|
|
|
|
|
|
|
|
|
|
## 思考题
|
|
|
|
|
|
|
|
|
|
|
|
在课程的最后,我还是照例给你留两道思考题:
|
|
|
|
|
|
|
|
|
|
|
|
1. 你觉得使用 Brave SDK,手动埋点生成 Trace 的难点在哪里?为什么?
|
|
|
|
|
|
2. 在生产环境中为什么考虑把链路追踪日志先推送到 Kafka 消息队列?
|
|
|
|
|
|
|
|
|
|
|
|
欢迎你在留言区和我交流讨论,我们下节课见!
|
|
|
|
|
|
|